The S&P 500 has grinded sideways now for nearly three straight weeks. This price action is certainly much different than what most traders would expect during late September and early October. The entire trading range for the S&P 500 (INDEXSP:.INX) thus far in October is growing increasingly narrow. That said, bullish sector rotation could provide a lift (more below).
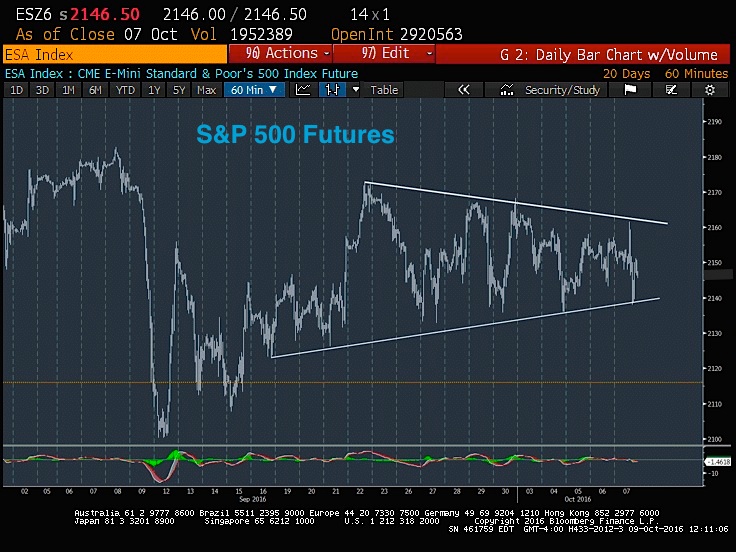
S&P 500 E-mini Futures Chart
Any move above 2168 would serve to breakout above this range, while under 2132 would be equally important, but bearish. The action in Dollar/Yen and U.S. Treasury yields (i.e. rally) is helping the Financial Sector (NYSEARCA:XLF) to strengthen. So I’m thinking the initial breakout should come on the upside as prices move back to new highs.
With this in mind, the recent slowdown in stock market breadth and momentum needs to be put into context. And, as mentioned, the tight trading consolidation should move to the upside given the positive sector rotation.
Key Takeaways
Ongoing bullish sector rotation paints a much different picture than what’s seen in the sideways action of the S&P 500. Relative breakouts vs the S&P (which typically happen before the absolute breakout) have occurred in the Financials, Energy, Transports, and Industrials sectors. As well, I’ve seen a huge pickup of relative strength in the Consumer Discretionary sector (which had lagged consumer Staples most of the year). Meanwhile, Interest rate sensitive and Defensively oriented groups such as Utilities, REITS, Homebuilders and Staples have underperformed substantially of late. And many of those under performers are hitting new multi-month lows vs the S&P 500.
The US Dollar Index has surged lately vs both the Pound Sterling and Japanese Yen. It appears to have broken out of its intermediate-term consolidation pattern (formed since last December). This initially has caused some selling in the Precious metals space, but has not yet affected the broader commodities indices in showing any meaningful breakdown. Emerging markets also have shown some evidence of stalling out. And should the US Dollar strength continue, the emerging markets space would likely suffer a deeper pullback. That could also spur underperformance vs developed global equities.
Also read: Transports Provide A Bullish Spark
Bond yields have begun to move up sharply across the globe. US treasury yields are breaking out of short-term downtrends across the curve (2, 5, and 10-yr yields). They have followed similar gains in UK Japanese, Spanish, Italian, Australian yields, just to name a few. Yield curves have steepened since late September, and the overall fear of higher rates and tapering of central bank support is showing up in yields. That said, this has helped the Financial sector and resulted in TNX widening out dramatically vs German Bund yields. This might be thought to offer safety given the European Banking woes hurting Deutsche Bank.
Short-term/ Intermediate-term Technical Thoughts For S&P 500 Futures
Short-term Thoughts (3-5 days): Bullish
Last week’s surge in Financials resulted in some notable outperformance vs the rest of the market. The Financial sector provided the sole positive gains of any of the 11 S&P sectors. For now, the combination of the recent sector strength and outflows of the Defensives is far more bullish than what might be gleaned by just eyeing the sideways trading range on the S&P 500. Given that market breadth remains in good shape, while sentiment remains subdued, it’s still right to view this bullish sector rotation as as just that. The trading range continues to be held by 2168-9 on the upside while 2132 looks important as support. While last week was a mild negative performance wise, prices barely retreated in a manner that undercut the prior days or weeks lows, and prices remain in striking distance of levels hit back in mid-July.
Intermediate-term Thoughts (2-3 months): Bullish
There isn’t any real evidence of that the bears were able to get anything going with seasonality trends in their favor (late september). And prices are now on the verge of pressing back to new high territory. Market momentum has turned back to positive on monthly charts while Advance/Decline remains at/near all-time highs. The positive effects of sector rotation should be bullish for equities as Energy, Consumer Discretionary and Financials have shown some signs of turning higher. As well, the Breakout in Transports should result in mean reversion for this former lagging sector. The upcoming US Election is likely to keep stock market sentiment fairly subdued given how close this race is shaping up to be. This should limit deeper selloffs to after the election. The longer-term level of momentum is at lower levels than 2015 despite prices being back near all-time highs. This could grow into an eventual concern (negative monthly divergence), but for now the rally for 4Q looks to be on the verge of getting underway.
Thanks for reading.
Get more trading insights and market analysis over on my blog Newton Advisor. Thanks for reading.
Twitter: @MarkNewtonCMT
Any opinions expressed herein are solely those of the author, and do not in any way represent the views or opinions of any other person or entity.


