From our How to Grow Your Wealth in 2023 we featured the projections for the Economic Modern Family.
We begin with the Granddad of the Family-Russell 2000 (IWM), In December 2022, we wrote this:
“The Russell 2000 IWM is the granddad of the Family. Hence, we take his performance seriously.
At the start of 2022, IWM was already breaking down, well ahead of the S&P 500 (SPY).
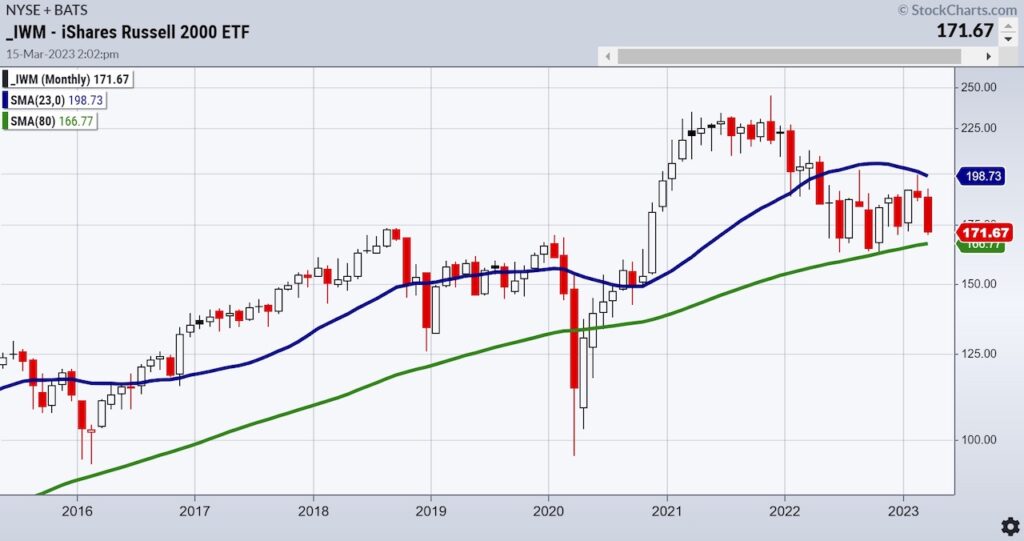
The monthly chart is the best one to use for a longer-term outlook for 2023.
The green line or 80-month moving average represents about a typical business cycle. The 80-month moving average is the megatrend identifier.
Should any of the key components fail the 80-month MA in 2023, the calls for “recession” or more pain from stagflation will only get more painful for the market.
As such, IWM only broke it once since September 2011 and that is during the pandemic. So, if we discount that time as unusual, we can say that it has been 12 years in a bullish megatrend.
In October 2022, IWM touched it exactly.
Now, coming into the new year, that October low is key. If IWM holds and gets back through the 23-month MA or blue line, then a bullish trend will continue.
Should the 80-month breakdown, I would prepare for a tough time with pandemic levels in focus.”
And here we are at the Ides of March.
IWM could not clear the 23-month moving average.
And, with the recent news, IWM has fallen in price, but still considerably above the 80-month moving average.
Neither indicative of growth nor recession, we’d call that a trading range.
We also call it stagflation.
With PPI and CPI coming in softer, on the heels of banks in crisis, the market turned its attention to the notion the Fed will reduce rates this year.
In fact, some predict the FED will lower rates by 2% come December 2023.
Sorry, but this resonates with the chaos theory and gold near $3000 per ounce.
Anyhoo, IWM held (although still weakest of the indices) and NASDAQ plus tech stocks took off.
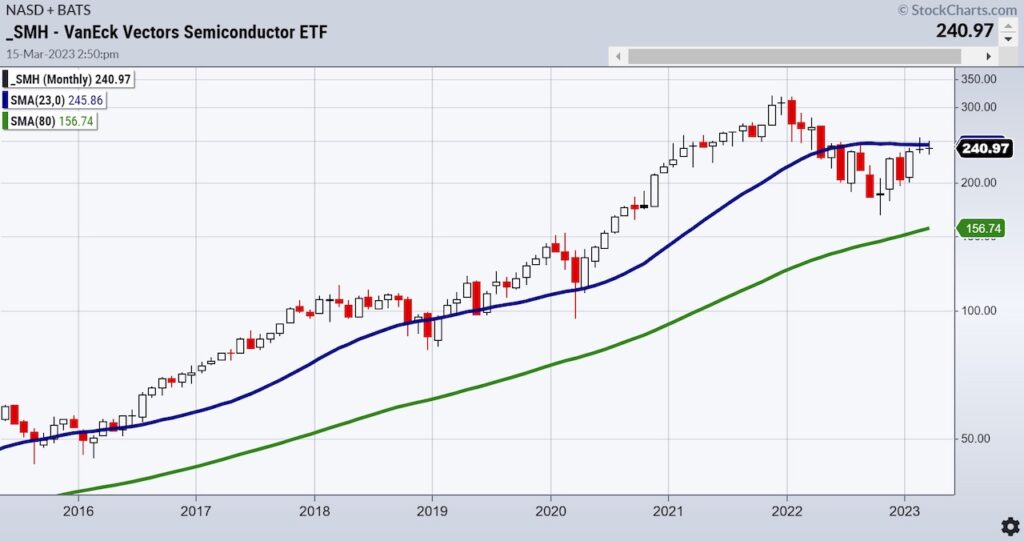
Which brings us to Sister Semiconductors.
From the Outlook:
“SMH has not traded below the 80-month MA since October 2010.
In fact, the U.S. tech sector and the survival of chip technology has been the bright spot for 13 years!
Even the pandemic did not bring this sector below the 23-month MA as we are heavily reliant on tech for everything.
1. Will that continue if the rest of the family fails, and
2. If SMH remains strong, can it ease the pain of recession?”
With March half over, we will see what our Sister Semiconductors are made of. Over the 23-month, and making money will be easier.
However, without Gramps in tow, it will be a short-lived rally.
Lastly,
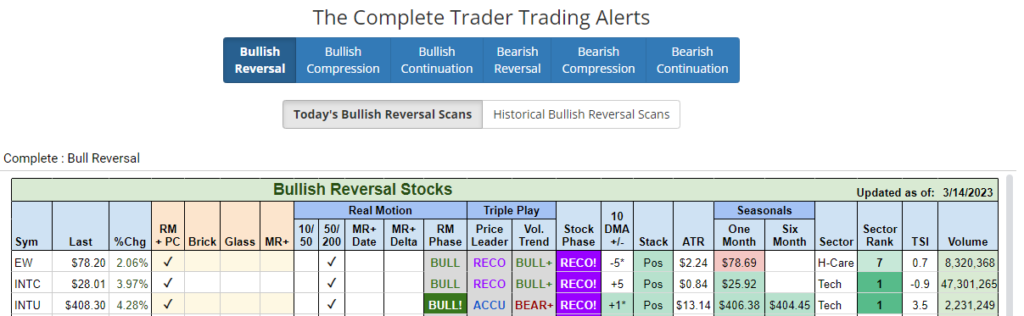
Our Complete Trader Bullish Reversal Scan had 2 tech stock picks. Intel (INTC) and Intuit (INTU).
2 Tech stocks that should benefit if this chip rally sustains.
Stock Market ETFs Trading Analysis & Summary:
S&P 500 (SPY) 390 remains highly pivotal especially on a closing basis 380 support
Russell 2000 (IWM) Calendar range support level at 172.00 and resistance 180
Dow (DIA) 310 support 324 resistance
Nasdaq (QQQ) Wow-290 key and 300 next area to pierce
Regional banks (KRE) 44 support 50 resistance
Semiconductors (SMH) 240 pivotal support-strongest yet still below the 2-yr biz cycle
Transportation (IYT) 218-219 so pivotal
Biotechnology (IBB) 126.50 moving average resistance
Retail (XRT) 60 big support and 64 big resistance
Twitter: @marketminute
The author may have a position in mentioned securities at the time of publication. Any opinions expressed herein are solely those of the author and do not represent the views or opinions of any other person or entity.
: Creating Bullish Divergence?")

 and Semiconductors (SMH): Concerning Price Pattern?")
 and Semiconductors (SMH): Concerning Price Pattern?")


