I spent all of last week in the media and in print, going over the importance of 2 key indicators. (See the media clips below)
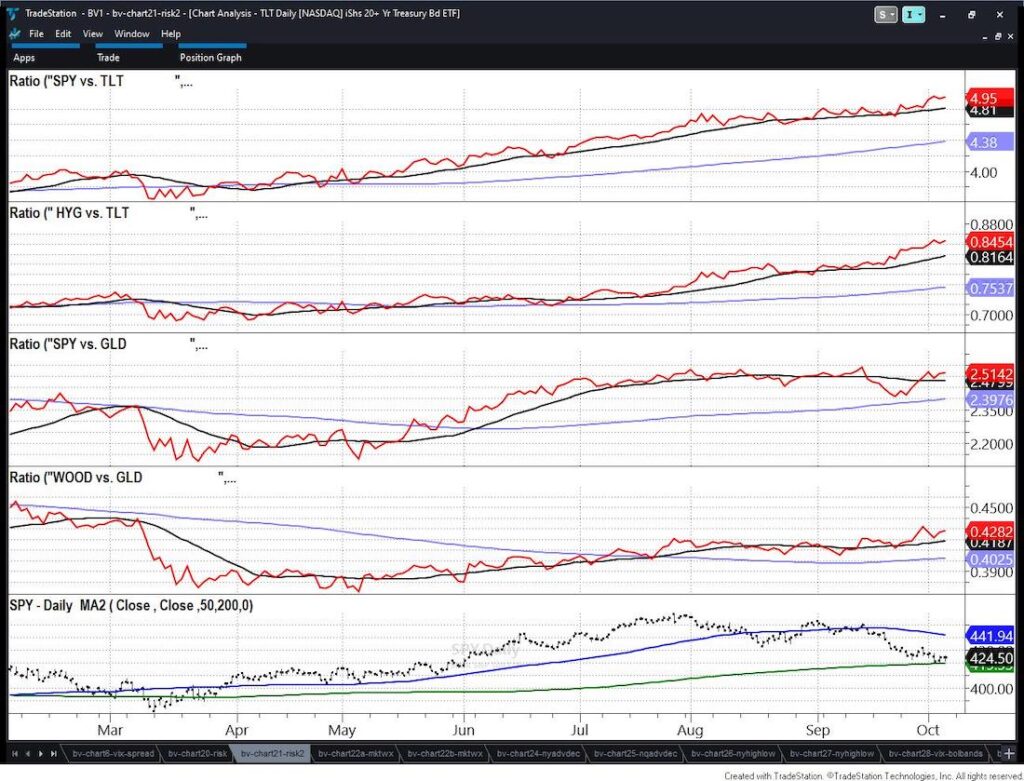
- Our risk gauges on Big View, all of which kept flashing risk on regardless of the doom and gloom and initial sell off in bonds and SPY.
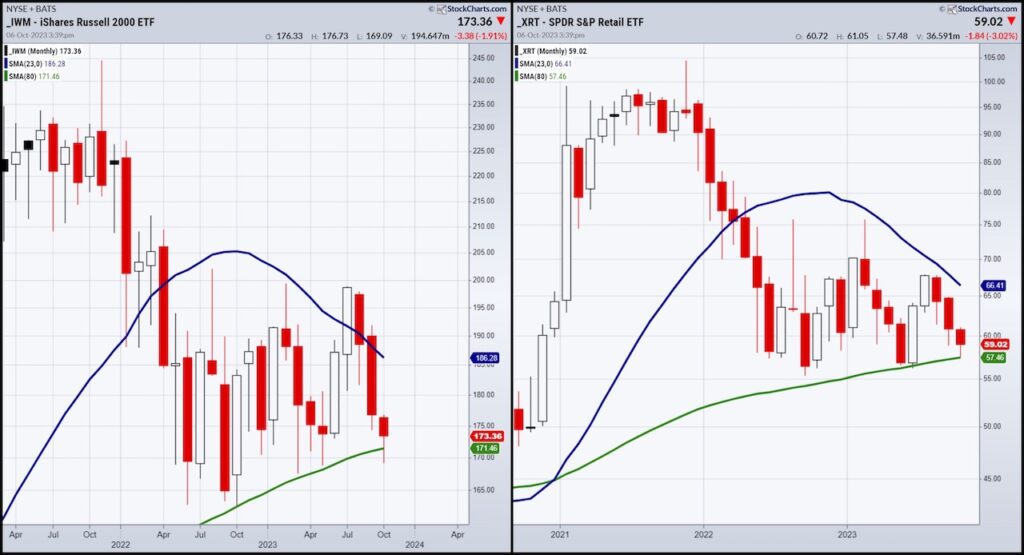
- The monthly charts on small caps and retail (IWM and XRT), both of which drew lines in the sand.
Although we have not changed our mind about the real possibility of stagflation as we head into 2024, (DBA and DBC 2 commodity ETFs continue to outperform the SPY), this clutch rally on Friday in the face of a strong employment report, was not unexpected.
Last week we wrote this:
“Now, along with Retail XRT, both IWM and XRT-Granddad and Grandma of the Economic Modern Family-have a new story to tell.
The 80-month moving average (green line) is a longer-term business cycle or about 6-7 years.
Besides the blip during covid, IWM has not BROKE that 80-month MA since 2010. XRT sits right above the 80-month.”
The day prior on the risk gauges we wrote this:
“If you are finding yourself fluctuating between bullishness and bearishness, then congratulations!
Hopefully, that also means you are waiting for certain signals to help you commit to one way or another.
Here are the signals we are waiting for before overly committing to a bias.
- As we wrote over the weekend, how the junk bonds (high yield high debt bonds), do independently, and how they perform against the long bonds (TLT).
- How the retail and transportation sectors do (along with small caps) as they represent the “inside” of the US economy.
- How DBA (ags) and DBC (commodity index) do relative to the strong dollar and higher yields.”
If you combine the rally on Friday, with the notion that our risk gauges stayed positive, the bigger question now is-
What’s next?
Recession to us, will be represented by a break of the 80-month moving average in either IWM or XRT and stronger if in both.
And, as much as we all love the save on Friday, the TLT closed down again, or bond yields rose.
Small caps (IWM) still closed down for the week as did Retail (XRT).
SPY and NASDAQ QQQ, however, closed the week higher.
Can that help keep the small caps and retail from failing the 80-month moving average?
Maybe.
DBA closed unchanged.
DBC closed much lower because of the drop in oil prices.
Commodities remain elevated regardless.
So the big questions for this week are:
- Can growth stocks boost the small caps, or will small caps drag everything down again?
- Can the risk gauges stay risk on-especially if bonds reverse at all and SPY begins to underperform?
- Can junk bonds continue to hold and outperform the long bonds?
We would like to see IWM get back over 177 and Retail get back over 61.00.
Otherwise, the first question will most likely be answered by no-this rally cannot sustain.
It seems the market took the jobs report as a peak in employment for 2023.
It seems that the bond market did not take it that way.
We are still at a precipice.
Bulls need to see the bond market steady and small caps improve.
The bears need to see higher for longer and small caps fail the 6–7-year business cycle.
Commodities traders need to see oil rebound, natural gas continue the rally, DBA grow some more green shoots, dollar to fail 106 and yields to at least, not go up any further from here.
Twitter: @marketminute
The author may have a position in mentioned securities at the time of publication. Any opinions expressed herein are solely those of the author and do not represent the views or opinions of any other person or entity.

: Worrisome to Broader Market?")
