Small cap stocks have been lagging the broader market and showing general weakness for many months now.
This is a core signal of risk-off and tells us that we need to be stock pickers. When the Russell 2000 finally perks up, it will tell us that the market is back into risk-on mode and most stocks will begin to elevate.
Today’s “weekly” chart of the Russell 2000 ETF (IWM) is simple and underscores the broader markets general weakness.
Note that the following MarketSmith charts are built with Investors Business Daily’s product suite.
I am an Investors Business Daily (IBD) partner and promote the use of their products. The entire platform offers a good mix of tools, education, and technical and fundamental data.
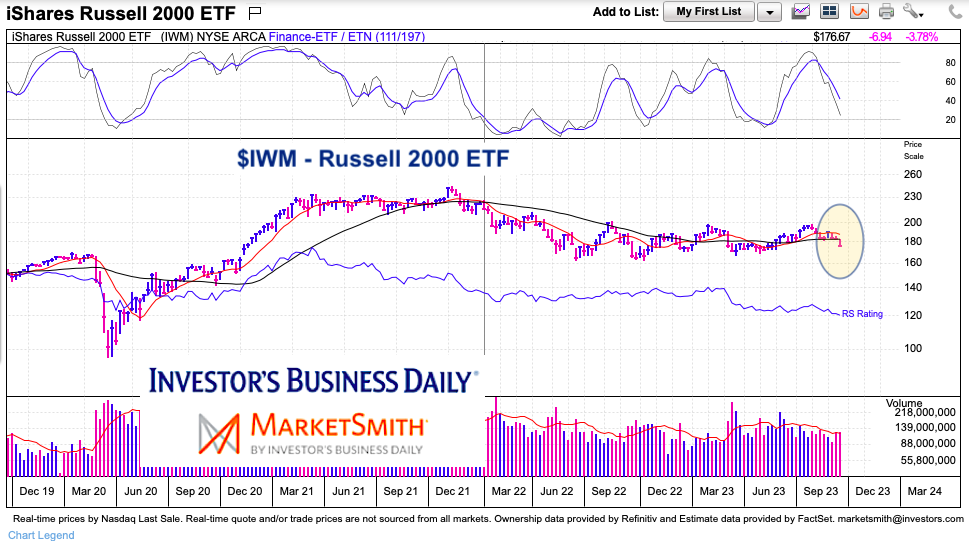
$IWM Russell 2000 ETF “weekly” Chart
Here we can see that the Russell 2000 (IWM) broke down below its 200-day moving average. This is another indication that $IWM isn’t healthy, and that the broader market is mixed at best.
Further, it’s hard to see the market finding solid footing until the Russell 2000 retakes its 20/50/200 day moving averages. And that may take some time. For now, look for out-performing sectors and out-performing stocks within those sectors.
Twitter: @andrewnyquist
The author may have a position in mentioned securities at the time of publication. Any opinions expressed herein are solely those of the author, and do not in any way represent the views or opinions of any other person or entity.

: Worrisome to Broader Market?")

