In “The Fed And Its Self-Defeating Monetary Policy” we focused our discussion on U.S. productivity, but weak and slowing productivity growth is not just an American problem.
All of the world’s leading economies are, to varying degrees, exhibiting the same worrisome pattern. And slowing productivity is something investors across asset classes should pay attention to in 2016.
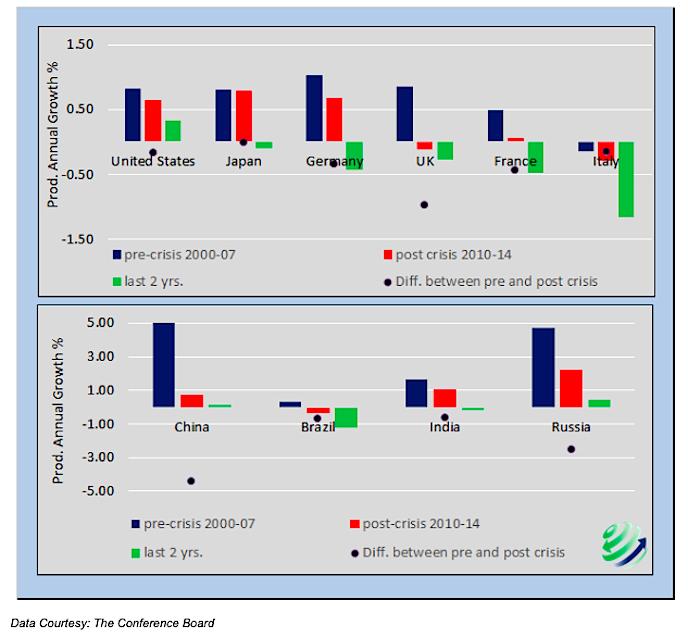
The graph below compares annualized productivity trends from three time periods – the 7 years immediately preceding the financial crisis, the 5 years immediately following the crisis, and the 2 most recently reported years (2013 and 2014). The black dots display the change in trend from pre to post crisis. In all cases the black dots are below zero representing slowing productivity growth.
More troublesome, the world’s largest economies are most recently reporting either negligible productivity growth or a decline in productivity.
Assuming that demographics are already “baked” and debt has been over-used to produce non-productive growth since well before the crisis, good old-fashioned productivity gains are what the global economy requires to produce durable organic growth in the developed world.
Central bankers, politicians and investors are well advised to understand this dynamic.
Twitter: @michaellebowitz
The author has no positions in any of the mentioned securities. Any opinions expressed herein are solely those of the author, and do not in any way represent the views or opinions of any other person or entity.


