The stock market remains on solid footing.
With today’s price action in equities mixed, and many commodities following through on this week’s rally, two scenarios remain omnipresent.
First, a potential worst case given the artificially low interest rates and all the geopolitical uncertainty:
Inflation currently at manageable numbers, turns to hyperinflation at unmanageable numbers.
Secondly, the potential best case:
This rally in commodities means global demand is increasing, thereby signaling overall economic growth.

Meanwhile, silver futures outperformed gold futures today as the silver to gold ratio got stronger in favor of silver.
Historically, that signals the start of increasing inflation.
With both of those possible scenarios in mind, let’s examine the ratio chart.
In July, we saw the ratio between silver and gold drop near all-time lows.
Then, once the ratio cleared the red line or a short-term moving average, silver got busy.
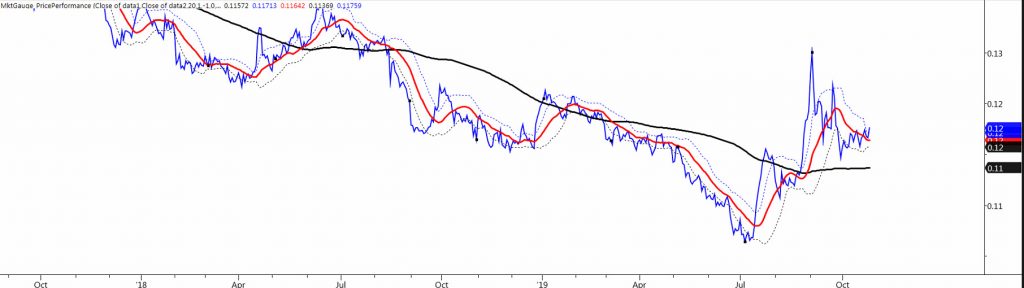
As with all sudden and fierce rallies off the lows, profit taking set in and since October, the price of silver has been consolidating.
Today, silver started to accelerate once again, thereby outperforming gold. I also like how the ratio is clearing the dotted line or Bollinger Band.
Gold miners also took off. Yet, silver has top status for the time being.
The implications support an inflation theory.
What we do not know yet, is at what point does the rising commodity and silver prices look healthy for equities versus at what point does that ignite too much inflation?
Regardless, my prediction leans towards the latter. For now, it’s been fun holding both a few of both equities and commodities.
S&P 500 ETF (SPY) climbed and closed over 300. This is your key pivotal price area.
Russell 2000 ETF (IWM) 153.50 is pivotal price support, 156 is resistance.
Dow Jones Industrials ETF (DIA) 270 is pivotal price resistance, 265.50 is support.
Nasdaq 100 ETF (QQQ) 193.50 is pivotal price support, 190.45 is key support. 194.50 is next resistance.
Regional Banks ETF (KRE) 53.00 is price support, 55.00 is resistance.
Semiconductors ETF (SMH) 122.75 is the nearest price support, 125.38 the all time highs.
Transportation ETF (IYT) 190 is price support, 195 resistance.
Biotechnology ETF (IBB) 105 is pivotal price support, 108 price resistance.
Retail ETF (XRT) 44 is price resistance to clear, 41.50 is support.
Twitter: @marketminute
The author may have a position in the mentioned securities at the time of publication. Any opinions expressed herein are solely those of the author, and do not in any way represent the views or opinions of any other person or entity.


