Silver is nearing an important price juncture and is likely to break up or down in the days / weeks ahead.
And, as we discussed earlier, that move should be a big one! Though Silver (NYSEARCA: SLV) has been known to buck the trend before (see prior article link), it is in the throws of a bearish descending triangle.
And the price support line for that triangle resides at the mid-line of the log chart trading range.
Let’s look at the charts and highlight these patterns.
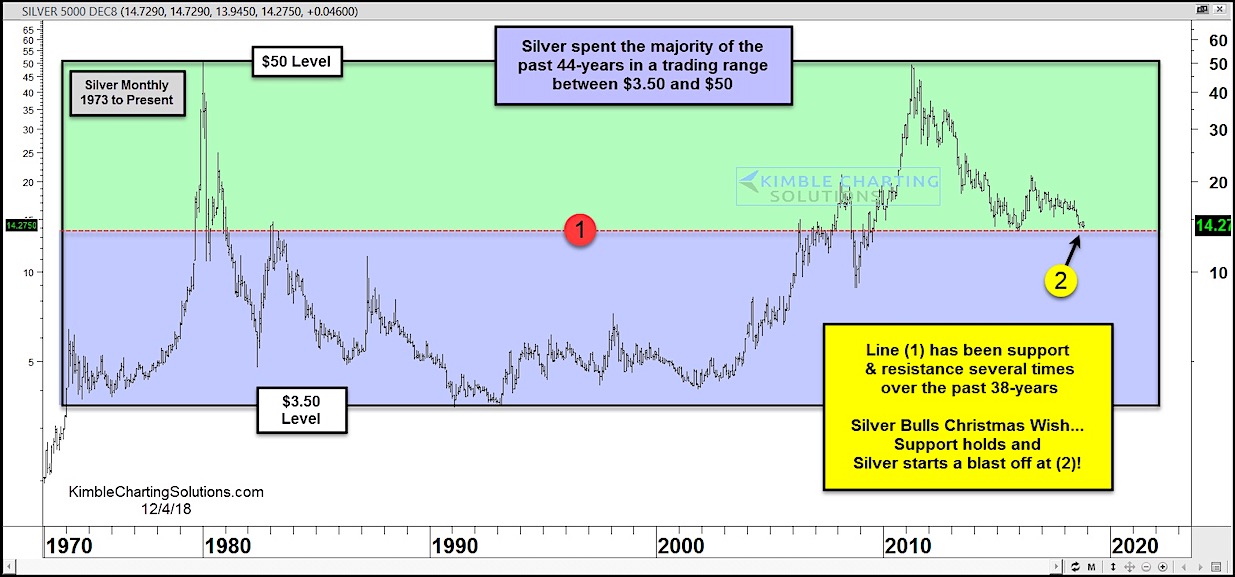
In the first chart, you can see that Silver remains in 44-year trading range between 3.50 & 50. It is currently testing the mid-support of that range at (2). This mid-line has been support and resistance several times over the past 38-years.
Will it hold?
Silver Monthly Chart with Trading Ranges
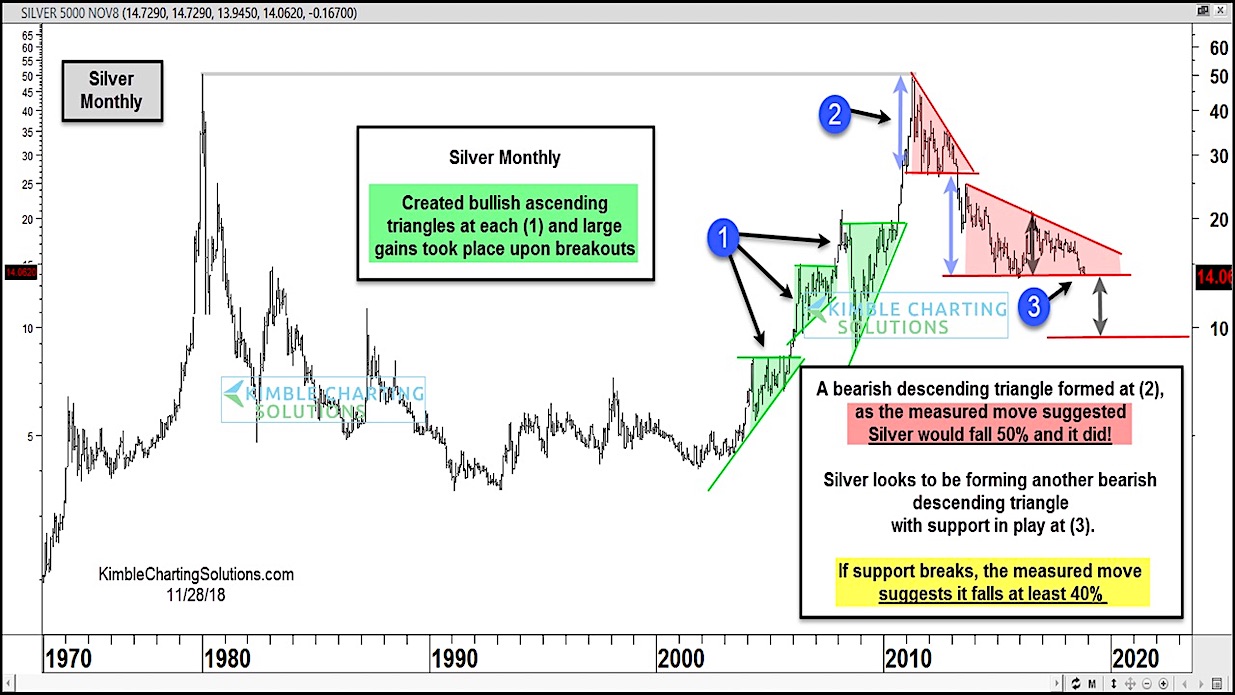
If silver breaks below its trading range support (first chart) and below support at (3) on the chart below, the measured move suggests it will fall at least 40%.
As we noted above and in our earlier blog, Silver is in a bearish descending triangle. Bulls hope Silver bucks the trend and pattern, while bears are waiting for the bottom to fall out.
In my humble opinion, Silver is facing one of the most important support tests in decades right now.
Silver Chart with Bearish Triangle
Note that KimbleCharting is offering a 2 week Free trial to See It Market readers. Just send me an email to services@kimblechartingsolutions.com for details to get set up.
Twitter: @KimbleCharting
Any opinions expressed herein are solely those of the author, and do not in any way represent the views or opinions of any other person or entity.
: Creating Bullish Divergence?")


 and Semiconductors (SMH): Concerning Price Pattern?")


