Silver’s run-up this year has been glorious for precious metals bulls. After bottoming out in March, the Silver ETF (SLV) rallied 150%.
But since peaking in August, Silver has seen a strong correction. In fact, the decline (from peak to trough) qualifies as a bear market.
Today we will take a closer look at the decline and highlight some key Fibonacci and moving average price support levels.
Note that the following MarketSmith charts are built with Investors Business Daily’s product suite.
I am an Investors Business Daily (IBD) partner and promote the use of their products. The entire platform offers a good mix of technical and fundamental data and education.
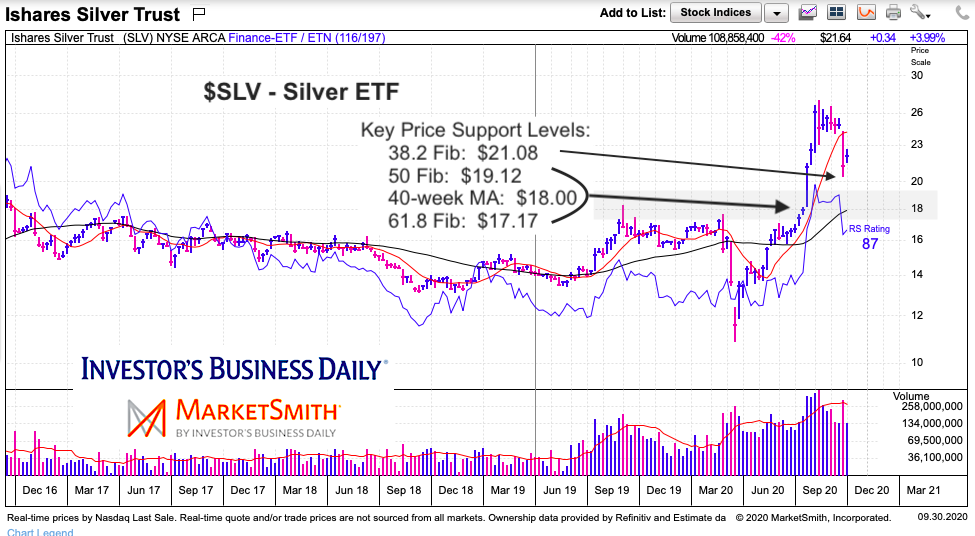
$SLV Silver ETF “weekly” Chart
The chart is annotated, so we can see that the initial whoosh lower touched down near the 38.2 Fibonacci retracement support (using March lows and August highs). That Fib comes in at 21.08 and is a very logical bounce (or reversal) point for a decline. The intraday low of the recent decline came in at 20.45, while the closing low was 21.17. So that Fib matters and should be watched as support going forward.
Should Silver decline further then traders would want to eye the $17 to $19 area for averaging in (if bullish). This area starts with the 50 Fib at $19.12, then the 40-week moving average at $18.00, followed by the 61.8 Fib at $17.17. Bulls don’t want to see price print any lower than that.
On the upside, there is a chance the Silver ETF (SLV) pushes higher to retest where it recently broke down (the long red candle) around $24 – $25.
Twitter: @andrewnyquist
The author may have a position in mentioned securities at the time of publication. Any opinions expressed herein are solely those of the author, and do not in any way represent the views or opinions of any other person or entity.


