Every spring, investors once again quote the market maxim, “Sell in May and Go Away.” Based on seasonal tendencies of the S&P 500 index over decades of data, the market has indeed tended to perform much better on average from November through April versus May through October.
But has this classic market truism really played out in recent history?
We’ll look at the recent evidence and see why newer investors have very good reasons for doubting what was once considered one of the ultimate market truisms. Both 2021 and 2020 saw strong performance from May through October!
So how can we tell whether 2022 will be any different? It’s all about price action. One chart in particular can help us to confirm an existing downtrend and anticipate when the selling pressure may be abated.
In today’s video, we’ll break down the seasonal trends and decide whether “sell in May” is a good approach for 2022.
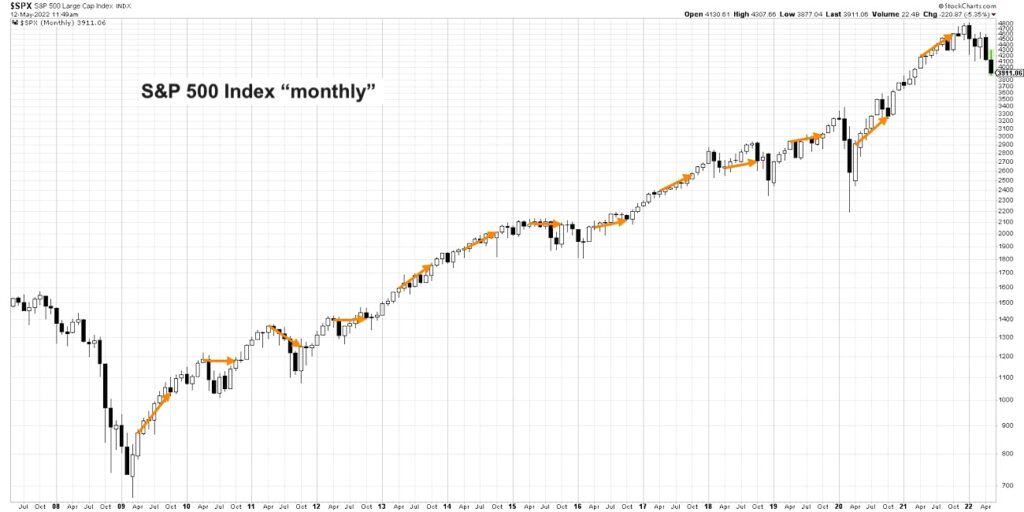
- How has the Sell in May thesis played out since the 2009 market bottom?
- What signals can we use to confirm that this common seasonal trend is indeed playing out as expected?
Which one chart call help us identify when the overwhelming selling pressure in the markets has been alleviated?
Ready to upgrade your investment process? Check out my free course on behavioral investing!
(VIDEO) S&P 500 Current Analysis and Past Performance – Sell In May?
S&P 500 Index “monthly” Chart
Twitter: @DKellerCMT
The author may have positions in mentioned securities at the time of publication. Any opinions expressed herein are solely those of the author, and do not in any way represent the views or opinions of any other person or entity.
: Creating Bullish Divergence?")


 and Semiconductors (SMH): Concerning Price Pattern?")


