Back in December, I wrote a blog about rising rates and the impending breakout for the Ultrashort Treasury Bonds ETF (TBT).
Since that post, treasury yields have rallied as bonds have slipped. And indeed, we got our breakout in the short bonds ETF.
So today, I want to share an updated chart with a potential upside target for TBT that I am eyeing.
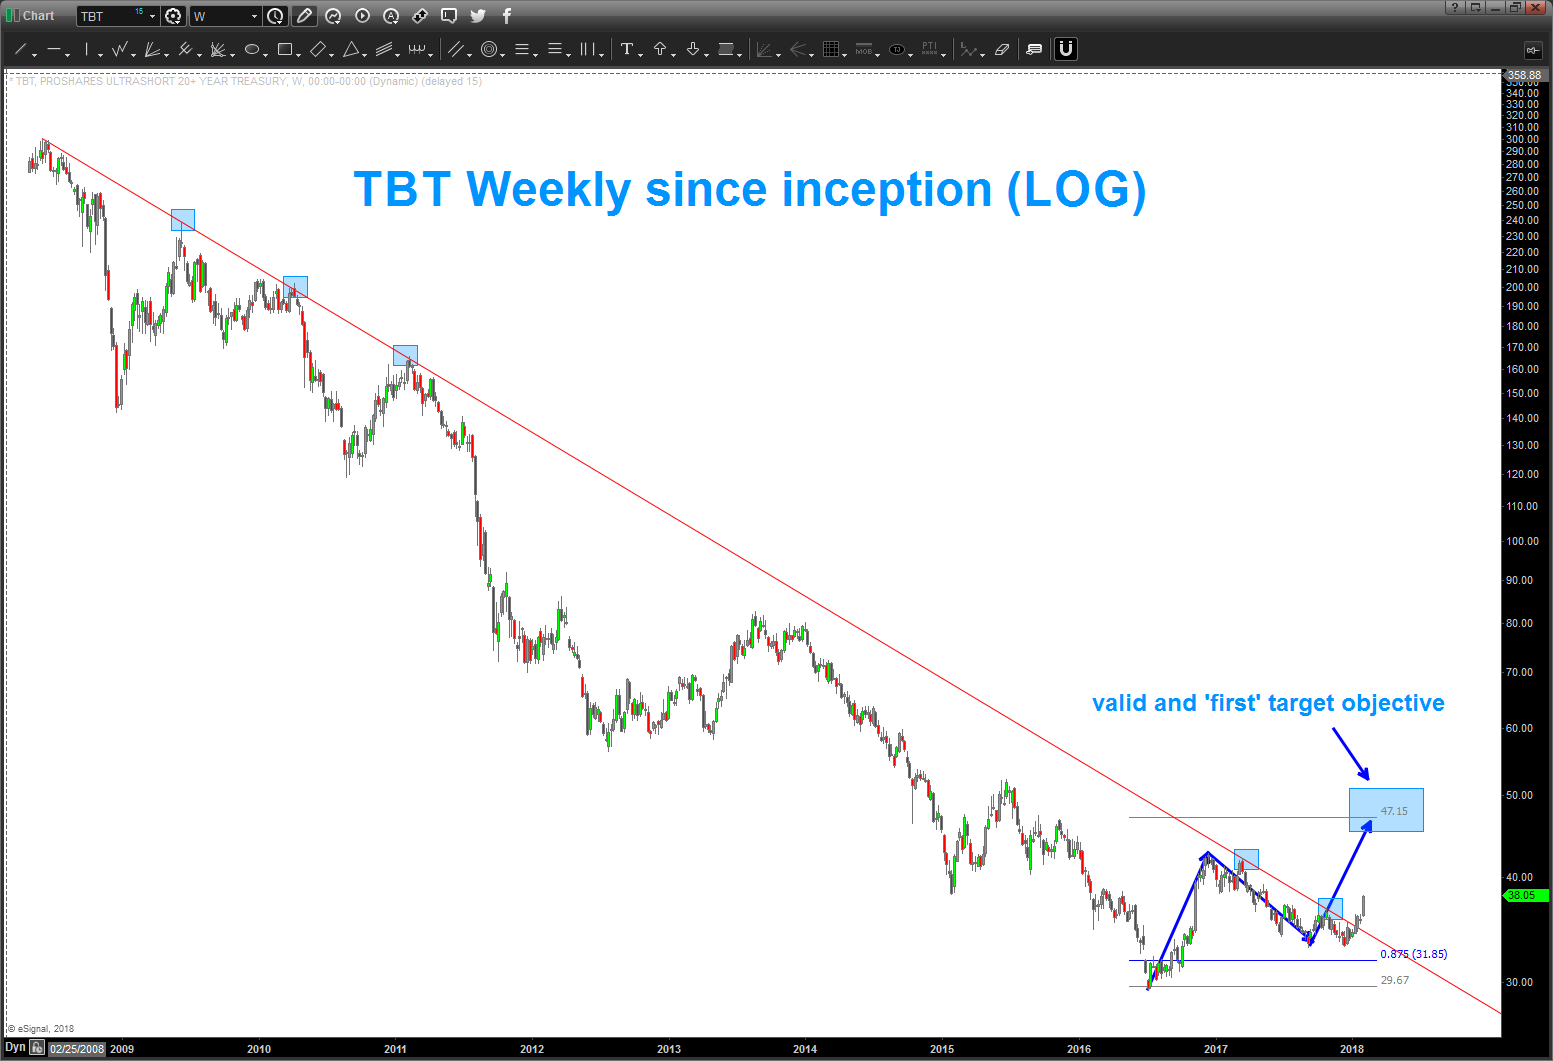
As you can see, the long-term downtrend line has been taken out and a likely bottom is taking shape.
Note that some breakouts above downtrend lines can signal a lengthy pause / consolidation, while others see follow through.
If TBT sees upside follow through on its breakout, then it could push to $47 this year. This also serves as an indicator of sorts, showing the markets move away from bonds as rates rise.
$TBT Weekly Log Chart
Thanks for reading.
Twitter: @BartsCharts
Author does not have a position in mentioned securities at the time of publication. Any opinions expressed herein are solely those of the author, and do not in any way represent the views or opinions of any other person or entity.


: Showing Some Signs of Emerging Strength")
