When the Chinese economy or stock markets are signaling an important turn or good/bad signal, the rest of the world needs to listen.
Today, we look at a long-term chart of the important Chinese stock market index, the Shanghai Stock Exchange Composite (SSEC).
Could the Chinese markets be nearing an important inflection point?
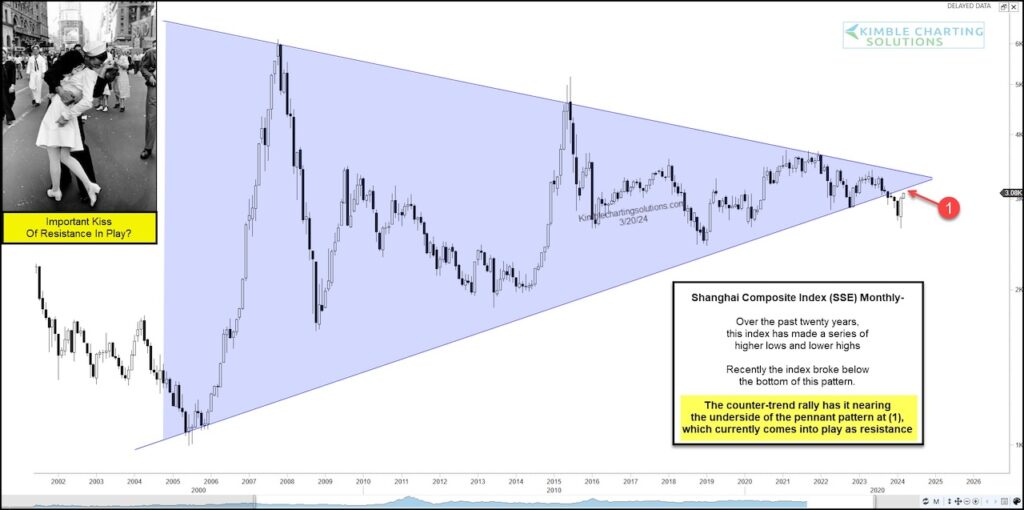
As you can see, the Shanghai Stock Exchange Composite (SSEC) broke down through the enormous pennant pattern. This was a bearish sell signal.
And now the SSEC is backtesting the underside of the triangle in a key test of resistance at (1). If the index can rally back up into the triangle and beyond, it would be bullish.
BUT, if the major Chinese index fails here and turns lower, then it would be very bearish.
What this index does at (1) will send an important message to stocks globally. Stay tuned!
SSEC Shanghai Stock Exchange Composite “monthly” Chart
Note that KimbleCharting is offering a 2 week Free trial to See It Market readers. Just send me an email to services@kimblechartingsolutions.com for details to get set up.
Twitter: @KimbleCharting
The author may have a position in mentioned securities. Any opinions expressed herein are solely those of the author, and do not in any way represent the views or opinions of any other person or entity.


 and Russell 2000 (IWM)")


