The following is a recap of the September 2 COT Report (Commitment Of Traders) released by the CFTC (Commodity Futures Trading Commission) looking at COT data and futures positions of non-commercial holdings as of August 30.
Note that the change in COT report data is week-over-week. Excerpts of this blog post originally appeared on Hedgopia.com – Paban’s blog.
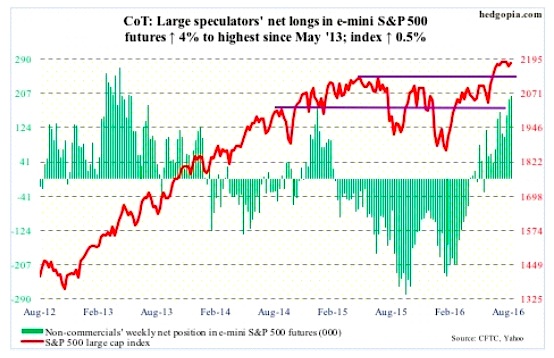
E-mini S&P 500 Futures:
August saw a first monthly doji on the S&P 500 Index (INDEXSP:.INX) since November last year. This follows five straight up months since the February bottom, of which July was up 3.6 percent.
Incidentally, NYSE margin debt showed some life in July, rising $27.2 billion m/m to $474.6 billion. Margin debt peaked in April last year at $507.2 billion; in May that year, the S&P 500 peaked. This time around, the index proceeded to score new highs without much help from margin debt.
For that matter, without much cooperation from fund flows as well.
In the week ended Wednesday, another $748 million left U.S.-based equity funds (courtesy of Lipper). Since the week ended February 10th this year, $75 billion has been redeemed.
That said, the persistent trend of outflows seen in these funds is not evident in the SPDR S&P 500 ETF (NYSEARCA:SPY). After outflows of $1.8 billion in the prior week, it attracted $2.9 billion in the week ended Wednesday (courtesy of ETF.com).
For seven weeks now, the S&P 500 has remained range-bound. Bulls defended 2160 support three times in the past six sessions. Bears will be in better position if they can wrest control of that support.
September 2 COT Report Data: Currently net long 200.1k, up 7.7k.
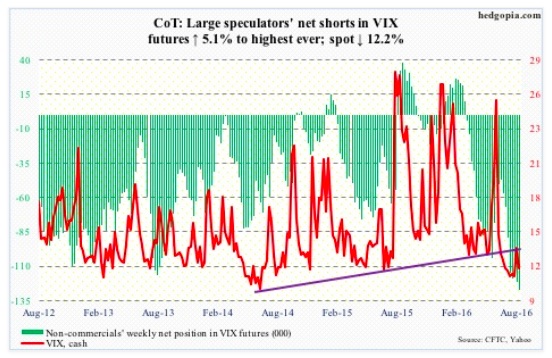
VIX Volatility Index Futures:
Intra-day in four sessions this week, spot VIX rallied past its 50-day moving average but was unable to close above it.
Since the Volatility Index (VIX) peaked on June 27th, anytime spot VIX tried to put in a good session or two, it got smacked left and right. It rallied from just north of 11 two weeks ago to 14.93 last Friday, but has not been able to hang on to the gains.
Consequently, the VIX-to-VXV ratio has languished in oversold territory for 10 weeks now, seven of them in mid- to high-.70s. Form mid-March to end-May this year, it similarly remained oversold for 12 weeks before surging.
September 2 COT Report Data: Currently net short 127.7k, up 6.2k.
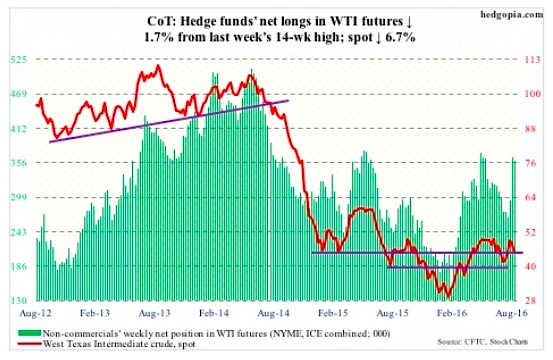
Crude Oil Futures:
The failure two weeks ago to break out of a potentially bullish reverse head-and-shoulders formation is proving costly for spot West Texas Intermediate crude oil. After last week’s three-percent drop, oil prices dropped another 6.7 percent this week.
Momentum was already down. Come Wednesday, crude oil prices suffered a daily bearish MACD cross, also losing the declining 50-day moving average. The 200-day – flattish – is 7.9 percent away. Wednesday’s EIA data was not much help.
In the week ended August 26th, crude stocks rose by 2.3 million barrels to 525.9 million barrels – a nine-week high.
Distillate stocks increased by 1.5 million barrels to 154.8 million barrels – a 16-week high.
Crude oil imports were up 275,000 barrels per day to 8.9 million b/d – the highest since September 14, 2012.
Gasoline stocks, however, fell by 691,000 barrels to 232 million barrels. This was the lowest since January 1st this year.
Refinery utilization rose three-tenths of a point to 92.8 percent.
Last but not the least, crude oil production fell by 60,000 b/d to 8.49 mb/d. Oil production peaked at 9.61 mb/d in the June 5th week last year.
Off the August 19th high of $49.36, the spot is now down five points. Support at $43-$43.50 has taken on a new significance. It was defended on Thursday and Friday.
September 2 COT Report Data: Currently net long 359.3k, down 6.1k.
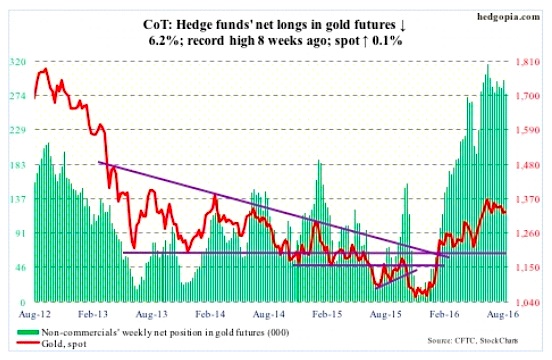
Gold Futures:
Gold bugs did step up to defend support at $1,300/ounce, and have an opportunity to push it higher. Gold prices are oversold on a daily chart, with prices having bounced off the lower Bollinger band.
A lot is going to depend on if the SPDR Gold Trust ETF (NYSEARCA:GLD) – and other gold-related ETFs – attract money. In the week ended Wednesday, GLD lost $642 million, after inflows of $26 million in the prior week (courtesy of ETF.com).
Also worth watching is if non-commercials use this as an opportunity to add to their already massive net longs of gold futures – or at least not begin to cut back. Net longs reached the highest eight weeks ago.
September 2 COT Report Data: Currently net long 276.3k, down 18.3k.
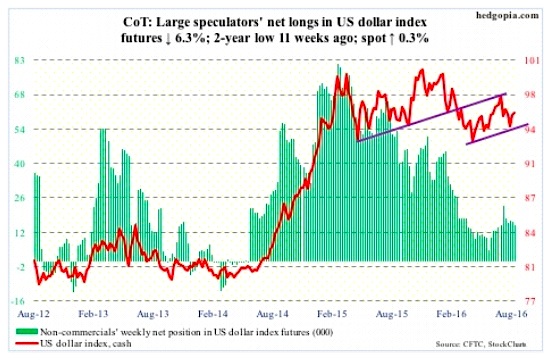
US Dollar Index Futures:
Dollar bulls defended the rising trend line drawn from May this year. It will be interesting to see if they will be able to push it toward at least the upper end of the channel, around 98.50. The all-important test, however, lies north of 100 – whenever that is.
Before peaking at 100.71 in March 2015, the U.S. Dollar Index rallied north of 25 percent in nine months. That high was later tested – unsuccessfully – in November that year (100.60). In essence, for the last year and a half the U.S. Dollar Index has been range-bound between 100-plus ad 93-plus.
A breakout is not what the Fed would like to see, as it can have immense repercussions for U.S exports, corporate profits, and what not. A persistently hawkish Fed ensures just that. This very factor probably ensures a breakout does not happen – at least not anytime soon.
This is precisely what is reflected in how non-commercials are positioned. Ms. Yellen’s rather hawkish Jackson Hole speech last Friday was unable to convince these traders to accumulate net longs.
Twice during the week, the Dollar Index’s rally attempts were repelled by the 200-day moving average. Daily conditions are now overbought.
September 2 COT Report Data: Currently net long 15k, down 1k.
Thanks for reading.
Twitter: @hedgopia
Author may hold a position in mentioned securities at the time of publication. Any opinions expressed herein are solely those of the author, and do not in any way represent the views or opinions of any other person or entity.


