Earlier today, we shared a few concerns for tech investors, focusing on the Nasdaq Composite chart.
Well, there’s another concern within Tech-land:
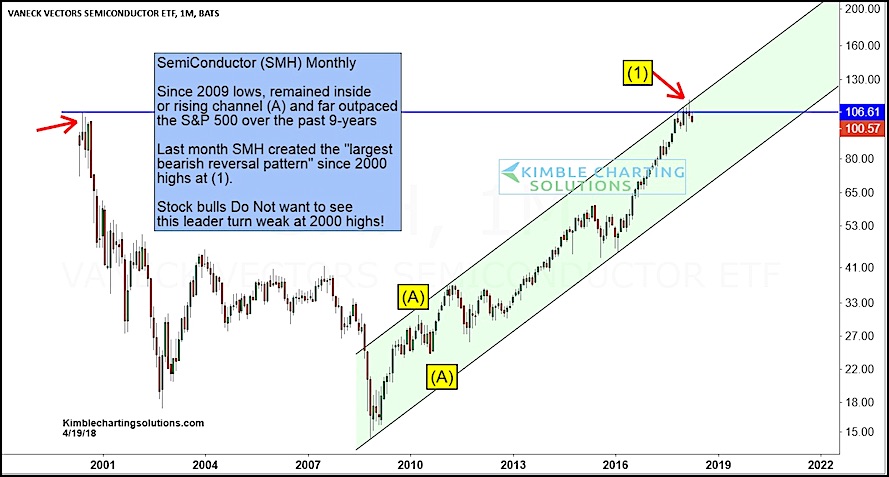
Potential weakness in the bull market leading Semiconductors.
In the chart below, you can see how strong the Semiconductors ETF (SMH) has been since the 2009 lows. For the better part of 9 years, SMH has traded within a rising bull market channel (A).
Its strength has lead it to the top of this channel (1), marking strong resistance. But this isn’t any ordinary resistance… the Semiconductors are also testing their 2000 highs. And for the cherry on top, the Semiconductor ETF created its “largest bearish reversal pattern” at this resistance level.
Bulls don’t want to see further weakness develop here as there’s a lot of room to the downside. Stay tuned!
Semiconductors ETF (SMH) Monthly Chart
Note that KimbleCharting is offering a 30 day Free trial to See It Market readers. Just send me an email to services@kimblechartingsolutions.com for details to get set up.
Twitter: @KimbleCharting
Any opinions expressed herein are solely those of the author, and do not in any way represent the views or opinions of any other person or entity.


")


