As readers know, we watch leadership sectors daily.
And today is no different as we take yet another look at the Semiconductors (SMH).
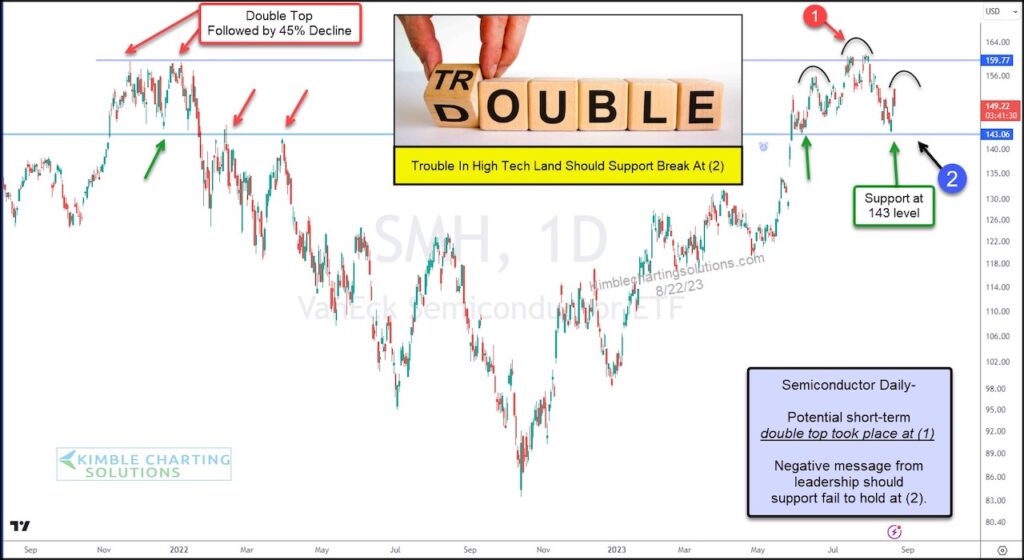
Below is a “daily chart of SMH showing the correction and subsequent rally.
We have two very important price areas to watch that could produce two very different outcomes.
The first price area of importance is double top resistance at (1). We can see that the prior decline started in from the same area and we have yet to breakout above (1). If price does breakout it would be super bullish.
The second area of importance is support at (2). this area has served as support and resistance (lower green and red arrows). A bearish message would be sent to the broader market should support fail to hold here.
Will we see a breakout at (1) or a breakdown at (2)? This could be decided in the coming weeks… and the outcome will have serious short-term implications for the broader market. Stay tuned!
$SMH Semiconductors Sector ETF “daily” Chart
Note that KimbleCharting is offering a 2 week Free trial to See It Market readers. Just send me an email to services@kimblechartingsolutions.com for details to get set up.
Twitter: @KimbleCharting
Any opinions expressed herein are solely those of the author, and do not in any way represent the views or opinions of any other person or entity.


