Semiconductor stocks are representative of the growth engine in the market.
They are cyclical and technology driven.
So when the Semiconductors Sector (NYSEARCA: SMH) slows down, investors should take note.
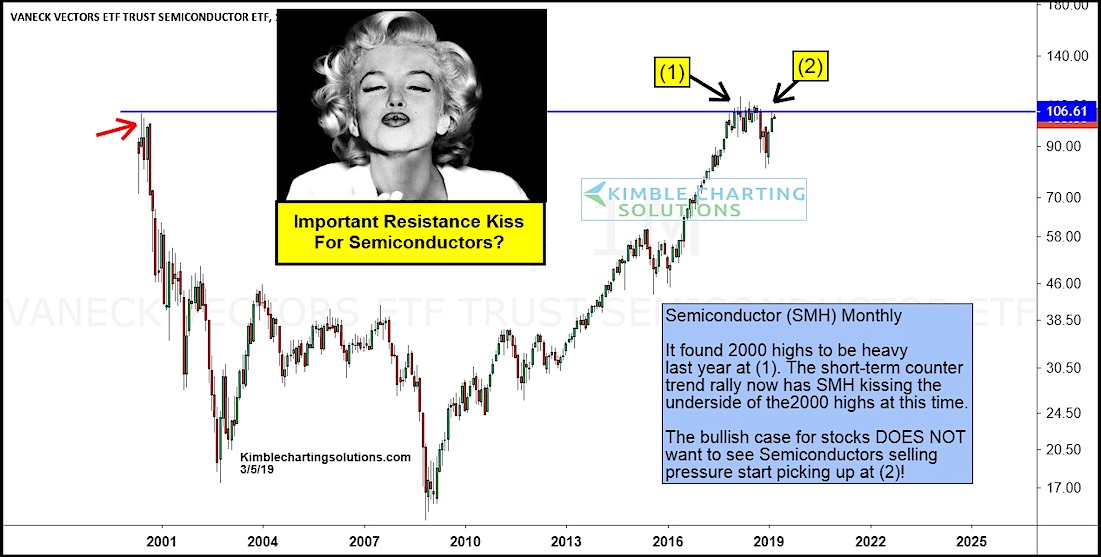
This is exactly what occurred last year. The Semiconductors Sector was slowed at the price area of the year 2000 highs (1). And it was a warning sign for the late 2018 stock market correction.
So where are we now? The Semiconductors (SMH) are hot again. And the current rally looks ready to test that familiar resistance line.
Will this “kiss” of the underside of the 2000 highs result in a breakout… or more selling?
This is setting up to be an important kiss of resistance for Semiconductors, as well as the broader stock market.
Semiconductor Index Chart
Note that KimbleCharting is offering a 2 week Free trial to See It Market readers. Just send me an email to services@kimblechartingsolutions.com for details to get set up.
Twitter: @KimbleCharting
Any opinions expressed herein are solely those of the author, and do not in any way represent the views or opinions of any other person or entity.


: Showing Some Signs of Emerging Strength")
