I sometimes get tired of reminding folks of the importance of technology stocks… and even more so, the Semiconductors Sector (SMH).
The Semiconductor Sector (SMH) lead the bull market higher for well over a decade… but this year they have lead the market lower, falling more than the S&P 500 and Nasdaq 100.
It’s fair to say that we pay particular attention to SMH, especially when it tests important support and resistance levels.
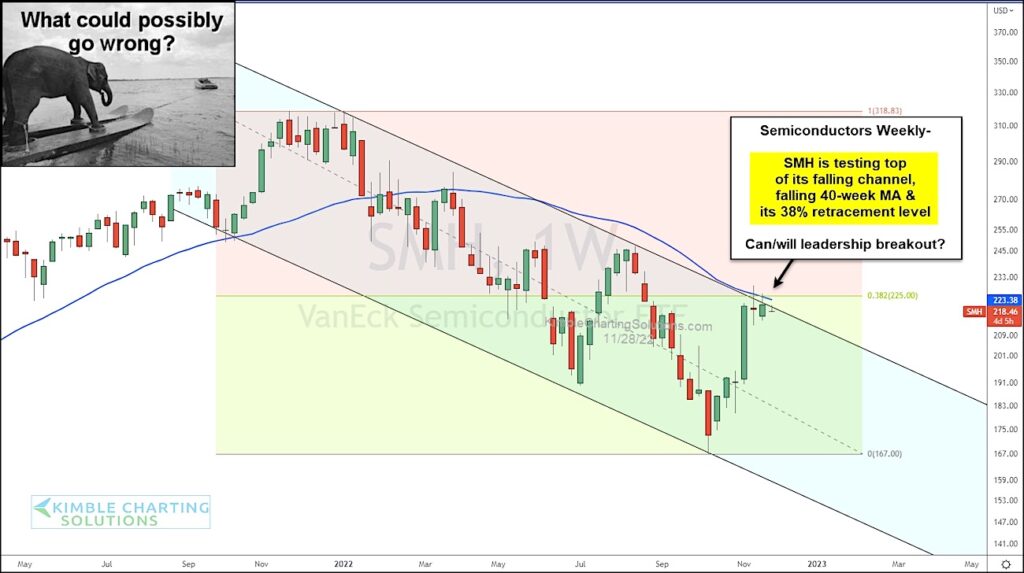
Today we feature a “weekly” chart of the Semiconductors ETF, highlighting a major test of price resistance. Not only is SMH testing its falling channel resistance, but also its falling 40-week moving average AND 38% Fibonacci retracement level!
Can/Will leadership breakout? Or breakdown?
The last two weeks, SMH has been essentially flat. I humbly feel where it closes this week, could be VERY important.
$SMH Semiconductor Sector ETF “weekly” Chart
Note that KimbleCharting is offering a 2 week Free trial to See It Market readers. Just send me an email to services@kimblechartingsolutions.com for details to get set up.
Twitter: @KimbleCharting
Any opinions expressed herein are solely those of the author, and do not in any way represent the views or opinions of any other person or entity.


