In mid-March, I warned that investors should “watch those divergences” on the Nasdaq.
Well, those bearish divergences have helped to form another bearish pattern that investors need to keep an eye on.
And this pattern will likely determine whether or not investors “Sell in May”.
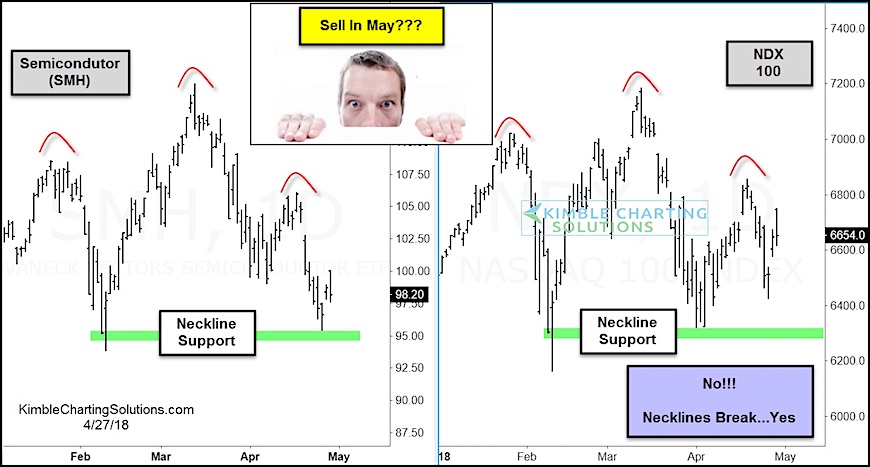
Today’s chart 2-pack includes the Semiconductors ETF (SMH) alongside the Nasdaq 100 (NDX). As you can see, both indices have formed bearish head and shoulders patterns.
BUT they will only prove to be bearish IF the neckline is broken to the downside. So all eyes should be on the green line in the charts below.
Tech stocks are giving investors reason for pause here… and will likely determine what’s next for the correction. Stay tuned!
Monday 2-Pack: Semiconductors (SMH) & Nasdaq 100 (NDX)
Note that KimbleCharting is offering a 30 day Free trial to See It Market readers. Just send me an email to services@kimblechartingsolutions.com for details to get set up.
Twitter: @KimbleCharting
Any opinions expressed herein are solely those of the author, and do not in any way represent the views or opinions of any other person or entity.


