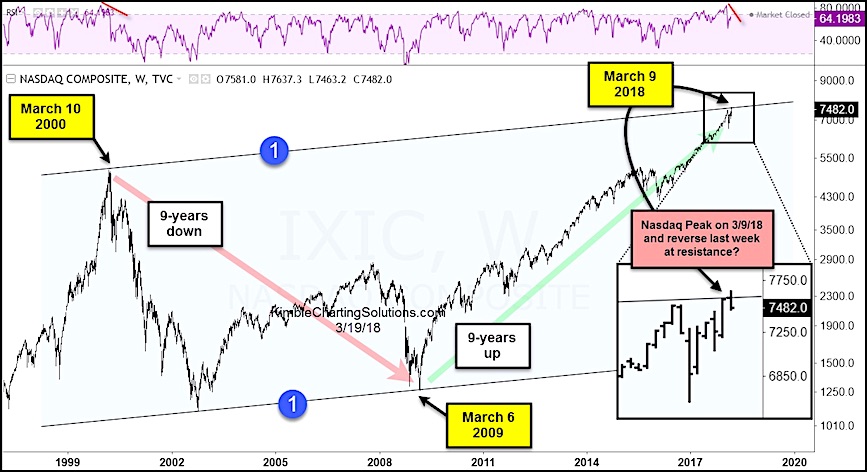
The latest leg higher in the bull market (off the 2016 lows) has been lead by the Technology sector and Nasdaq Composite.
FANG stocks (Facebook, Amazon, Netflix, Google) have given the Nasdaq an extra burst of momentum, helping to create a self-fulfilling ride higher… but that’s also given rise to the everyday investor idea that the ride will last forever.
Back in February, several stock market indices hit long-term resistance at the same time. This created a short-term market top and gave life to the February stock market correction.
After the correction, the major stock indices recovered. And the Nasdaq has made marginal new highs.
So what’s the concern?
While the Nasdaq was making new highs (March 9), the Dow Industrials and S&P 500 were not. That divergence is worrisome by itself… but it’s not the only divergence. While the Nasdaq was making new price highs, its RSI momentum indicator was not.
Since that peak, tech stocks have come under pressure. Could this 2-pack of bearish divergences spell trouble for the market?
Nasdaq Composite Long-Term Chart
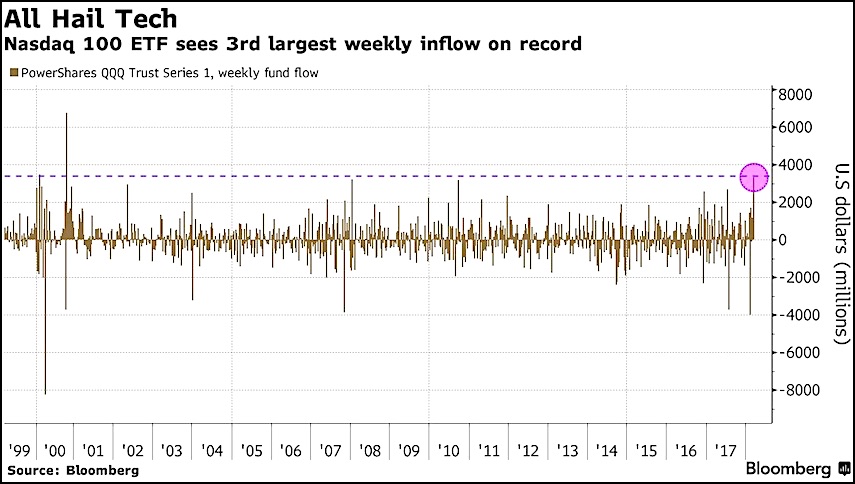
It’s also worth noting that weekly inflows were near record levels as the Nasdaq was testing the top of its long-term channel!
Note that KimbleCharting is offering a 30 day Free trial to See It Market readers. Just send me an email to services@kimblechartingsolutions.com for details to get set up.
Twitter: @KimbleCharting
Any opinions expressed herein are solely those of the author, and do not in any way represent the views or opinions of any other person or entity.


