One of the most interesting things about July in the market is the biannual reset of the 6-month calendar range.
Here is a chart of the NASDAQ 100 with the January 6-month calendar range drawn in.
To clarify, it is the solid green line that goes perfectly horizontal across the screen.
The lower chart is the Real Motion momentum indicator. The bottom is the daily volume.
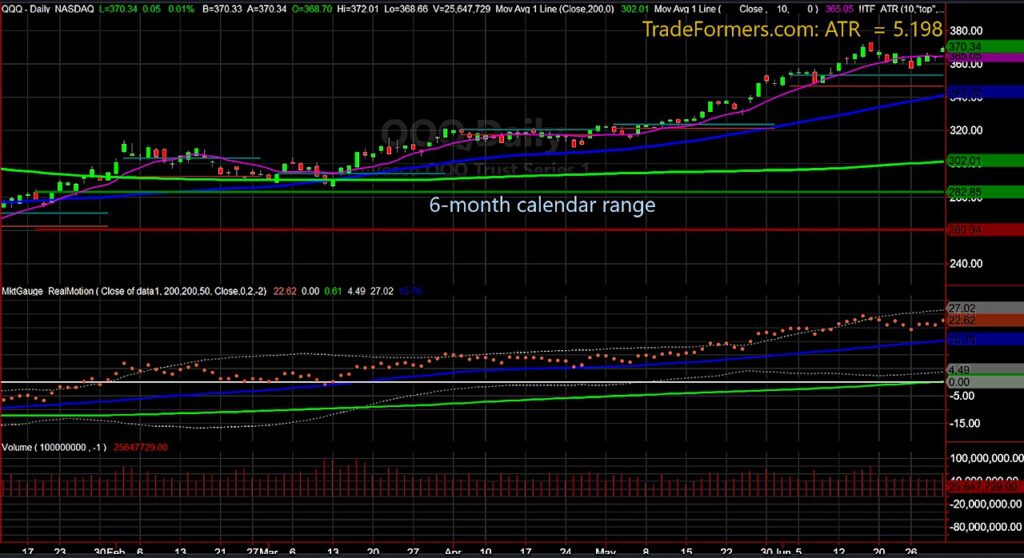
Since the beginning of 2023, QQQ cleared the 6-month calendar range high and never looked back. We had a brief test in March, but no violation.
As we are about to reset that range, note the momentum. QQQs are working off a mean reversion from early June. The current momentum, considering how close QQQs are to the recent highs made June 16th, is not bad, but meh.
The volume pattern in July thus far is also meh. So, we do not know yet how much more upside versus downside the large cap growth stocks have yet.
What we do know though, is that the NASDAQ looks one way, while the small caps look completely different.
In January IWM cleared its 6-month calendar range high. Then, in March, IWM failed those highs.
Since then, IWM has not been able to get back above the calendar range high on a closing basis.
The Real Motion momentum indicator is also mainly meh but holding. And looking at volume, IWM has had only 1 accumulation (June 29th), on an up day since June 26th.
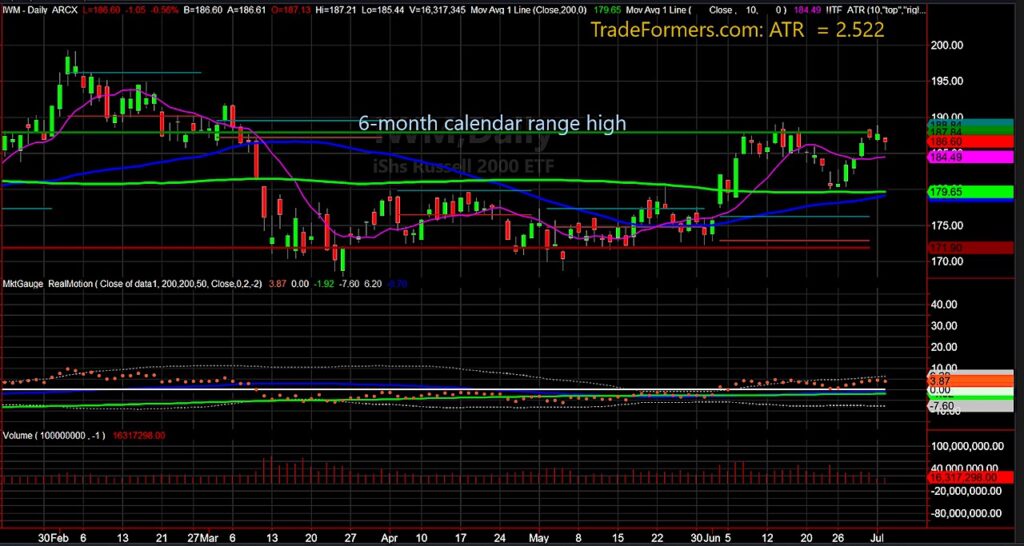
While NASDAQ did not look back once that calendar range high cleared, small caps to date, refuse to clear.
Nonetheless, with the reset, we are open for anything.
Our guess is that if IWM can clear the calendar range we got ourselves at least a leg higher and perhaps more. We imagine this would give value stocks a boost.
However, should IWM fail to clear the calendar range high and worse, break down under a new 6-month calendar range low (the thick red horizontal line), then it would be hard to think NASDAQ sustains current levels.
Either way, the range will reset in less than 2 weeks.
Stock Market ETFs Trading Analysis & Summary:
S&P 500 (SPY) Needs one more push or begins to look a bit toppy based on lethargic momentum
Russell 2000 (IWM) 190-193 still the overhead resistance to clear
Dow (DIA) 34,000 support to hold
Nasdaq (QQQ) Still working off a reversal top until it takes out 372.85
Regional banks (KRE) Need a new move over 42
Semiconductors (SMH) 150 support
Transportation (IYT) 250 pivotal and a potential correction /mean reversion in store
Biotechnology (IBB) 121-135 range
Retail (XRT) 63 support
Twitter: @marketminute
The author may have a position in mentioned securities at the time of publication. Any opinions expressed herein are solely those of the author and do not represent the views or opinions of any other person or entity.


