Bond prices plummeted, yields increased, and U.S. indexes fell again Monday.
The major U.S. indices have fallen for the past two weeks, and on Monday, most markets closed near their lows.
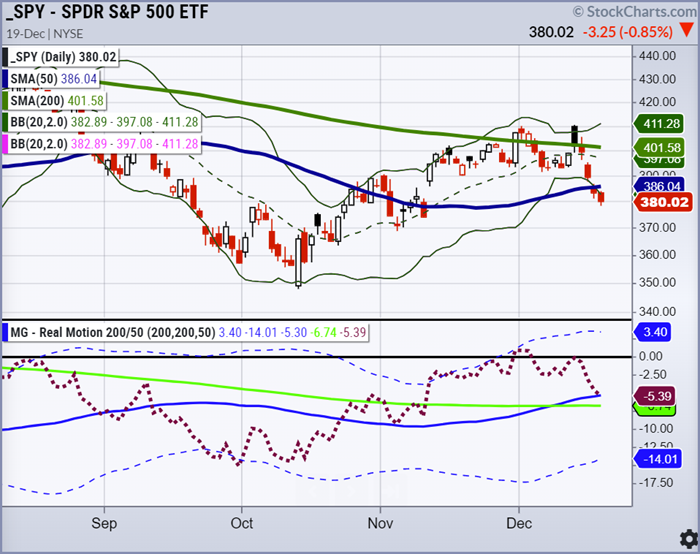
The S&P 500, represented by the SPY ETF above, closed significantly below its 50-day moving average today. The Real Motion Indicator above indicates that the SPY’s price is not oversold.
December usually is bullish during a mid-term election year, and seasonality favors higher stock prices, but not this month.
While conflicting signals exist, most of MarketGauge’s trading indicators have pointed to risk-off during December.
The CPI print and subsequent December Fed hike are in the rearview mirror, but the relentless market selling prompts the question of whether any Santa Claus Rally will occur before 2023.
Sellers were clearly in control on Monday for the fourth consecutive trading day, so any further price deterioration this week should be respected.
The Real Motion Indicator above shows measured downward momentum in line with the S&P 500’s price decline.
This should provide traders and investors one more reason to be vigilant and not surprised if the market moves lower but also open to a Santa rally if key overhead price levels are swiftly regained.
Except for the Diamonds (DIA), all major US indices (SPY, QQQ, IWM) are below their 50-day moving averages, and in line with the Real Motion Indicator above, US indices are not oversold.
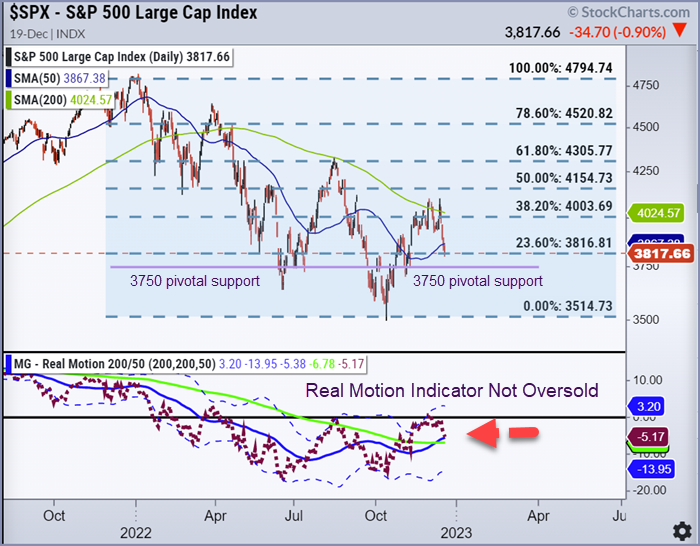
S&P 500 resistance levels to confirm more upside are 3850, 3910, 3930, 3950, and 4,000, and pivotal support levels now are 3800, 3750, and 3500.
3750 is a crucial support area.
Stay alert in this ordinarily quiet holiday trading week and watch price action closely. Know your risk, have tight stops, and take profits when prudent.
Stock Market ETFs Trading Analysis & Summary:
S&P 500 (SPY) 375 support and 390 resistance
Russell 2000 (IWM) 170 pivotal support and 176 resistance
Dow (DIA) 324 first level of support and 334 first level of resistance. The only index above its 50-WMA.
Nasdaq (QQQ) 265 pivotal support and 276 resistance
Regional banks (KRE) Pivotal support is 53 and resistance 59.
Semiconductors (SMH) Support is 204 and 213 resistance.
Transportation (IYT) 211 pivotal support and 222 is now resistance.
Biotechnology (IBB) 130 was pivotal support and 139 resistance. Closed at 130.56 next level of support 127.
Retail (XRT) Closed slightly below 60. 57 pivotal support and 63 is now resistance.
Twitter: @marketminute
The author may have a position in mentioned securities at the time of publication. Any opinions expressed herein are solely those of the author and do not represent the views or opinions of any other person or entity.


