We believe there could be two positive effects from beginning to raise interest rates, but there could also be a headwind. On the positive side, by beginning to raise rates, the Federal Reserve removes the uncertainty of when that first rate hike will occur (similar fascination with the timing of the second and following hikes seems unlikely) and it serves as a vote of confidence for the health of the economy. The headwind, which we saw hints of in 2015, was that without the actual or perceived promise of more accommodation (i.e., the removal of the Yellen put), overall stock market volatility could rise toward historical norm. While not necessarily pleasant to endure, it would be a function of a market that is standing on its own, and from that perspective could be welcome.
Stock market corrections of 10% (which was much ballyhooed when one appeared in 2015 for the first time in four years) have historically been a regular part of the annual stock market pattern. Look for more of that in 2016.
What about inflation? The most recurring client question we have gotten in recent years is on the subject of inflation. The divergence between what the CPI or PCE price index shows and what is revealed in the monthly budget of consumers can be baffling. 2016 may be the year that we get some resolution. To be sure, energy prices may continue to fluctuate and technological gains will continue to have a deflationary impact. But we are also seeing some evidence of inflation. Shelter costs account for nearly one-third of the CPI basket (for comparison, energy is less than 10%). The CPI for housing is up over 3% for the past year, and a continued recovery in the housing market could cause further upward pressure. Now, as the economic expansion broadens and businesses are increasingly concerned about a shortage of skilled workers, wage gains are beginning to re-accelerate. With expectations for inflation going forward so muted (5-year and 10-year implied forward inflation rates are both below 2%, versus long-term averages near 2.5%) the market could be vulnerable to even modest upticks in inflation. After a decade of worrying about deflation, the Federal Reserve might enjoy the chance to burnish its inflation fighting reputation as the price indexes start to reflect the experience of so many consumers. For 2016, we expect inflation could surprise on the upside but the longer-term trends should remain relatively sanguine. As such, the overall yield curve could drift higher in 2016, but some flattening is also expected, with the short end likely rising more than yields at the long end.
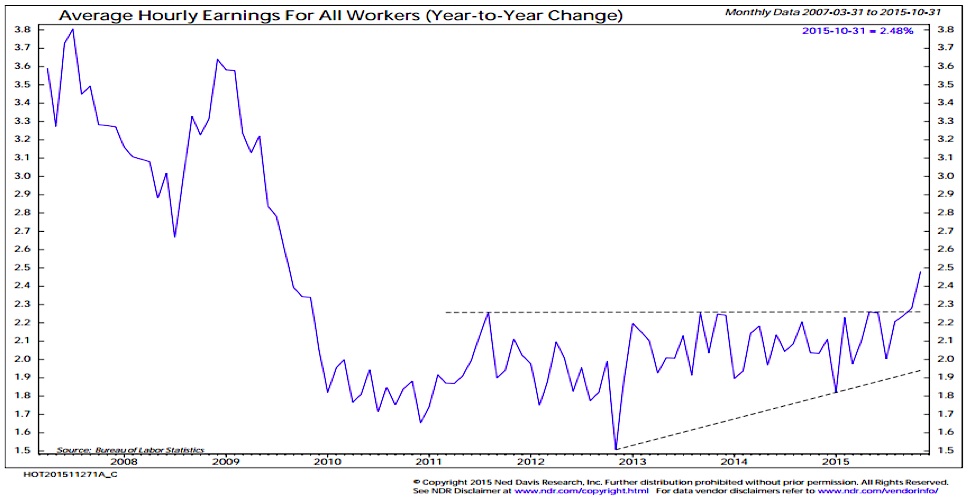
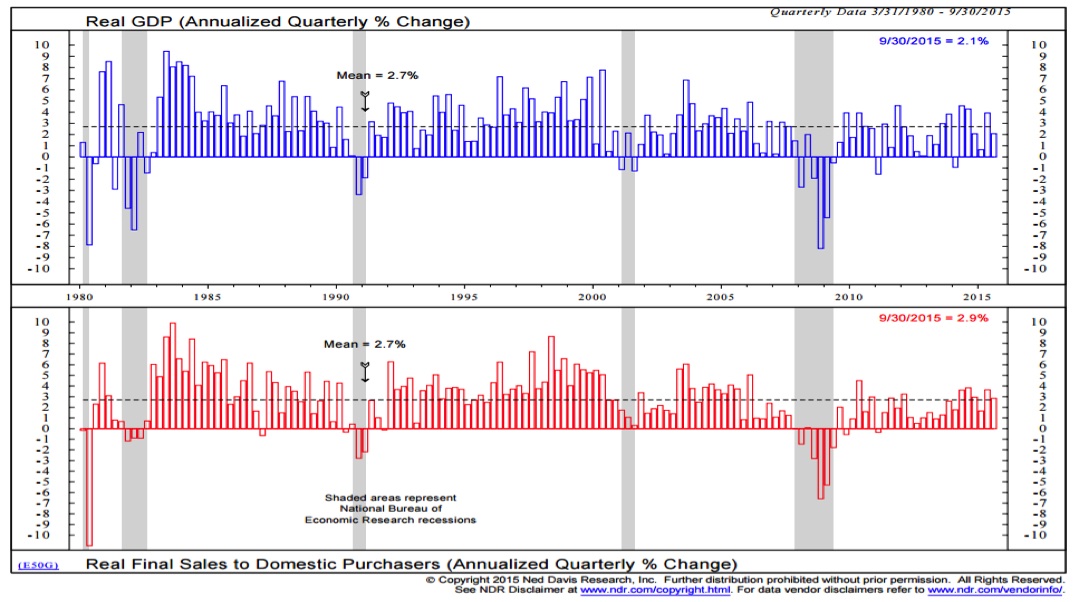
Economic Fundamentals: Overall economic growth remains modest, with pockets of strength being seen in some sectors. In fact, growth in real final domestic demand has been above its long-term average in five of the past six quarters (through the third quarter of 2015) and there is some evidence that we are actually seeing a broadening in participation in the recovery. Real median household income now appears to have bottomed and while 2014 showed some slippage relative to 2013, this comes in the wake of upward revisions to the 2013 data. Job growth remains healthy (even if not as robust as in the earlier stages of the recovery), wage growth is accelerating and the housing market continues to recover. More of the same seems likely for 2016 although acceleration in growth at this point would not be too surprising.
There has clearly been some slowing of growth (and even contraction) in manufacturing, and global growth trends remain challenging, but the service side of the U.S. economy remains strong. Despite the international headwinds, there is little evidence that recession risks are on the rise in the United States. The current business cycle has been drawn out and slow to emerge, and so from a purely calendar basis it seems the recovery could be in the late stages. More likely, manufacturing is experiencing a mid-cycle slowdown and the universality of bearish views in that sector suggests a bottom is imminent.
In fact, the global growth situation may be more constructive than many fear. Take for example China. While the growth rate there has slowed in recent years, its overall contribution to global growth will be higher in 2015 (due to a larger base) than it was a decade ago when it saw double-digit annual growth rates.
Valuations: We have learned another lesson in not putting too much emphasis on forecasts. Earnings were supposed to have been up double digits this past year (based on analyst expectations), but instead were down more than 5%. As such, even with a relatively flat year for stock prices, excessive valuations have not been relieved. Earnings growth could well rebound in 2016 – the conditions for that are in place and S&P 500 operating earnings consensus has them rising nearly 20% in 2016. Whether this matches the reality we see next year remains to be seen.
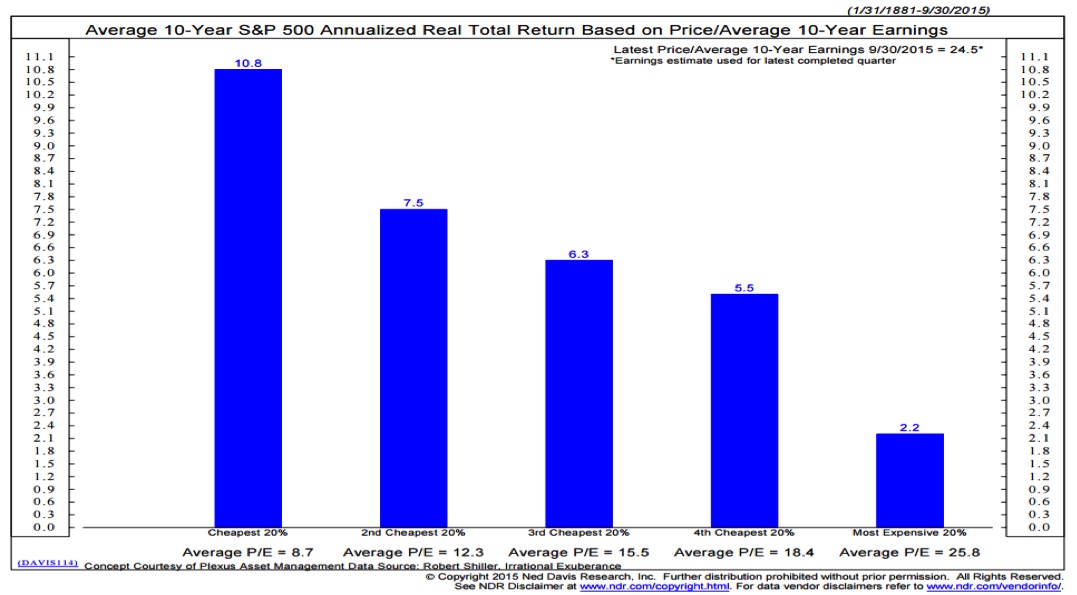
Valuations may not be useful market timing indicators, and the relationship between price-earnings ratios and short-term stock market performance may not be compelling. But we are not in the business of forecasting stock market price action (any more than we would be interested in forecasting earnings or economic growth) but in managing risks. From a risk management perspective, the relationship between valuations and forward stock market returns over the longer run is as compelling as it gets. When stocks are cheap, forward returns are above average; when stocks are expensive, forward returns are below average. Stocks are currently expensive, according to some measures more expensive than in 2000 or 2007.
Investor Sentiment: The valuation indicators suggest that new buyers of stocks need to pay a premium for earnings (relative to historical P/E ratios) at current levels. This may be because so many investors have already bought and hold stocks. Household asset allocation levels based on actual mutual fund and ETF exposure (a $16 trillion survey if you will) shows exposure to stocks approaching levels seen in 2000 and 2007. Bond exposure is near its long-term average. Exposure to cash is historically 37% – right now it is half that.
Cash is despised (to some degree rightly) in the current environment because short-term interest rates are near zero. But the allure of cash is not just the income it produces, but the liquidity it provides and the opportunity to put it to work in the future. There is precious little of that right now. Even as investors and regulators focus on measuring and maintaining liquidity, lost in the discussion is that measured liquidity in periods of calm has little relationship to actual liquidity in periods of stress. There were opportunities to learn that lesson in 2015 and more will likely come in 2016.
Various surveys can provide evidence of near-term greed and fear, and leaning against those extremes can be useful for tactical investors. But the lack of liquidity makes bumpy rides more likely and a fully invested public is not typically a precursor to a major leg higher for stocks.
Seasonal Patterns/Trends: Get ready for noise, another presidential election is upon is. We will be inundated (particularly those of us living in so-called swing states) with promises of prosperity and relentless fear-mongering from both parties as the general election heats up in mid-2016. If history is a guide, the best opportunity for stocks to make gains will be in the first quarter (when the election is a relatively distant concern) and the fourth quarter (when stocks tend to celebrate, regardless of which party is headed for the White House for the next four years. The second and third quarters could be choppy as promises and threats dominate the airwaves and the national conversation.
continue reading on the next page…

: Showing Some Signs of Emerging Strength")
