The S&P 500 Index (INDEXSP: .INX) fell 8 points to 2942 last week, a decline of 0.3%.
At the same time, the Russell 2000 (INDEXRUSSELL: RUT) rose by 17 points to 1567, an increase of 1.1%.
Our projection this week is for stocks to move higher, with a “sell the news” on the trade war reaction possible early in the week.
After three weeks of gains, the S&P 500 Index tightened a bit last week, as economic data eased and trade enthusiasm faded, as I pointed out in the latest Market Week show.
Consumer confidence for June and new home sales for May both fell in relation to the previous month and also missed expectations.
However, core durable goods orders for May increased by 0.3%, which exceeded expectations.
Watch this week’s stock market video – Week of June 24 (and see charts and analysis below)
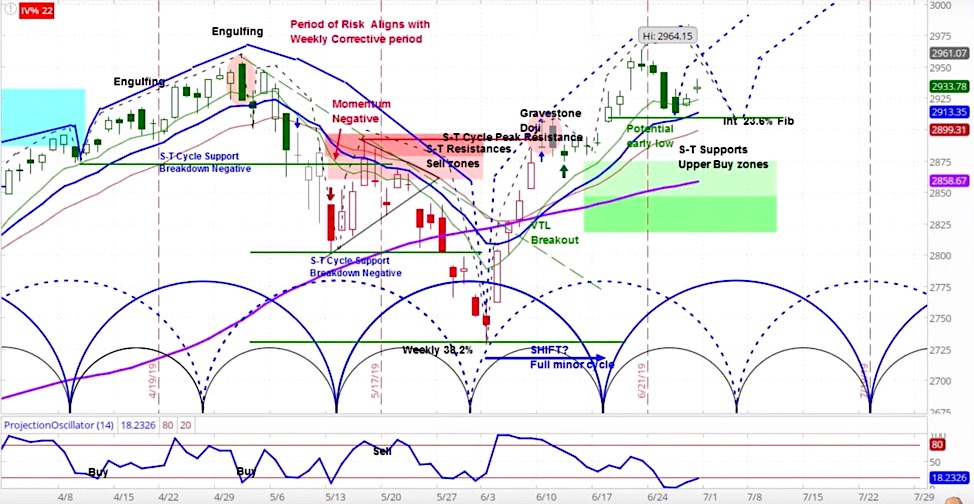
S&P 500 (SPX) Daily Chart
Our approach to technical analysis uses market cycles to project price action. Last week the SPX pulled off of what may have been its low for the current minor cycle corrective phase.
Based on price action and the pause in the trade war, it is likely an early-week pullback will be met with more buying.
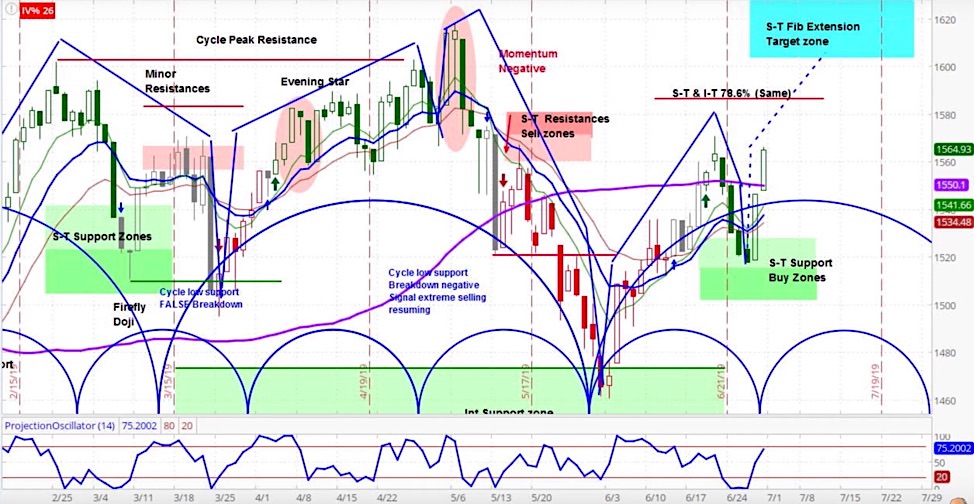
Russell 2000 (RUT) Daily Chart
We also consider how correlated indexes may affect price action. Last week the Russell 2000 (RUT) clearly bounced off a significant low in its current minor cycle, popping 3.2% on Thursday and Friday. Our projection is that the RUT is likely to continue to the 78.8% Fibonacci extension at 1585, possibly moving beyond that.
Putting these analyses together, outside of minor pullbacks, the strong bullish action in the RUT suggests that the minor correction seen last week is over. We are looking for bullish action in the major indexes for the next couple of weeks. Thus, were there to be an early week dip, our analysis suggests it would offer a buying opportunity for nimble traders.
For more from Slim, or to learn about cycle analysis, check out the askSlim Market Week show every Friday on our YouTube channel.
Twitter: @askslim
Any opinions expressed herein are solely those of the author, and do not in any way represent the views or opinions of any other person or entity.

: Creating Bullish Divergence?")

: Creating Bullish Divergence?")


