As some of you know, I call the Russell 2000 (NYSEARCA: IWM), the Granddad of the U.S. Economic Modern Family.
I do so because the Russell is comprised of 2000 small cap stocks that are 99.86% located in the United States.
He’s kinda cute and super important.
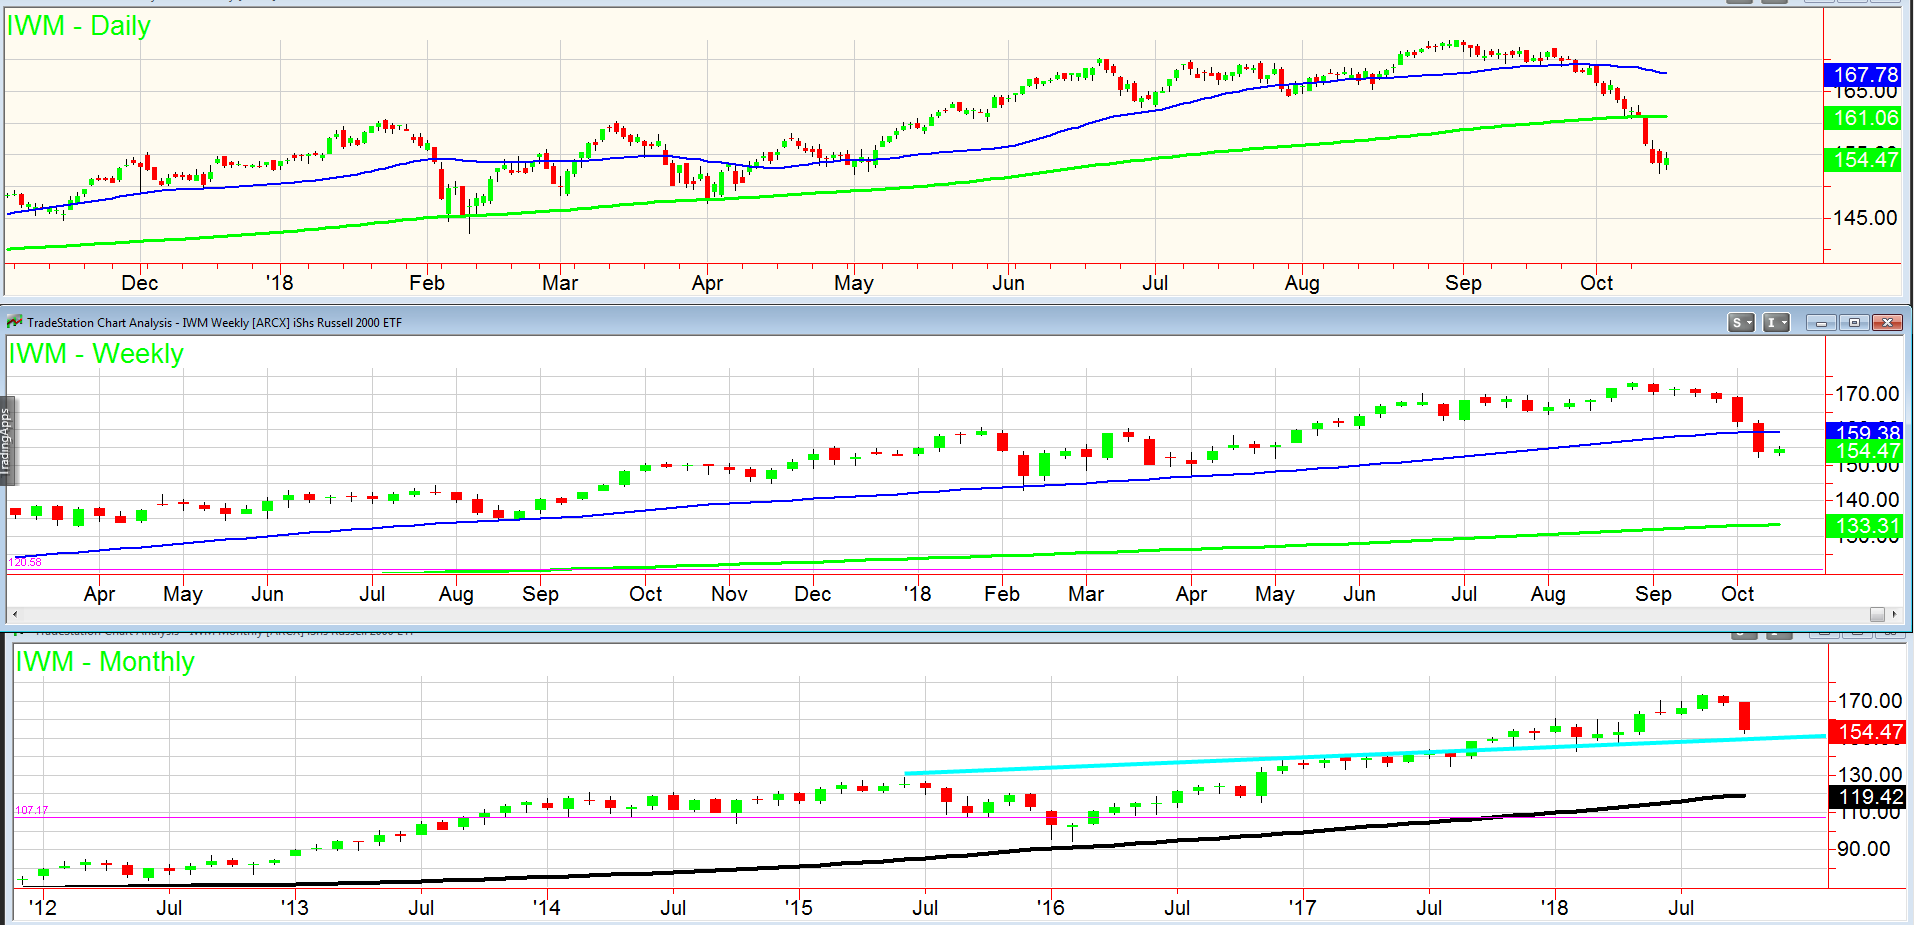
On Friday, the Russell 2000 (IWM) made a new multi-month low.
Today, IWM had an inside day.
Thus far, IWM is putting in an inside week (very early, though.
Two of the three timeframe charts have broken down.
Are we worried?
 Let’s put it this way, we are certainly cautious.
Looking at the charts, this is the second week, unless IWM gets back over 159.40 soon, it will close under the 50-WMA.
Yet, resurrection is not impossible.
With the multi-month low and today’s inside day, a move over 155.76 could take IWM up to test 159.40.
The monthly chart shows big support at around 150. So a bounce after the recent sell-off has a high probability.
However, that probability factor decreases the longer a rally takes to happen.
Now that IWM has worked off its oversold conditions, the flipside is also a probability.
A move under Friday’s low or under 151.88, will spook lots of investors who have bought this recent dip.
That should take IWM down to the monthly channel and quite possibly closer to 147.20.
And please continue to watch Granddad’s kin.
Granny Retail XRT could rally over 47.75. While Transportation IYT, also with an inside day, could give the clearest signal of what comes next.
As a former independent commodities trader in NY, I have seen every market condition possible. I have simplified the process by using a combination of fundamental and technical analysis for swing trading. This is now a stock picker’s market.
Would you like to hear from a seasoned veteran, who will stay by your side for the next big move?
Please join me tomorrow at 7 PM EST for a free webinar!
Here are important trading levels across key stock market ETFs:
S&P 500 (SPY) – 273.89 is the 50-Week MA which is not only pivotal, but crucial to hold for the health of the market
Russell 2000 (IWM)– 150 is next best level. It had an inside day and now, must over 155.76 to have a shot of recovering
Dow Jones Industrial Average (DIA) – This did not have an inside day, which I would have preferred to see. If it breaks the 200 DMA at 251.41, expect more downside
Nasdaq (QQQ)– After a bona fide reversal pattern with volume last Friday, this too had an inside day.
KRE (Regional Banks)-Teeny range inside day
SMH (Semiconductors) – Inside day and looking vulnerable
IYT (Transportation)– Could not close over 191.75, yet with the inside day, which way it goes-above that level or below 185.96 will be a good tell.
IBB (Biotechnology) – A quick test of 111.25 the 200 DMA and then a retreat
XRT (Retail) – 46.91 the 50-WMA which it’s holding. If clears and holds over 47.75, would consider an active long-looking for a quick pop or gone.
Twitter: @marketminute
The authors may have a position in the mentioned securities at the time of publication. Any opinions expressed herein are solely those of the author, and do not in any way represent the views or opinions of any other person or entity.


