Over the past few days, I’ve been watching the Russell 2000. And more specifically, the Russell 2000 (RUT) to S&P 500 (SPX) performance ratio. It’s no secret that the Russell 2000 and the small caps have been severely underperforming their large cap buddies in the S&P 500 this year.
In fact, as of yesterday’s close the S&P 500 was +5.94% vs the Russell 2000 -2.58% YTD. But perhaps the Small Caps were ready for a relative strength bounce.
What? I know, that sounds crazy. And to be clear, that doesn’t imply that the bottom is in. It simply means that perhaps the Small Caps were due to perform in-line (or better) than the market for a matter of days following yesterday’s losses. In short, this could mean a bigger rally than the S&P 500 OR it could mean a bit less of a drop than the S&P 500.
Why? Thus far, we’ve seen two occurrences this year where a massive divergence has developed between Small Caps and Large Caps. First came March-April, where we saw the small caps drop nearly 10 percent from their highs, while large caps held up fairly well. And the second is occurring right now. In fact, the recent Small Caps sell off has brought the RUT to short-term oversold levels and the RUT:SPX ratio to near-term extremes. I mentioned both yesterday at the close:
$IWM $RUT – Perfected daily 9 buy setup today. Still weak but will be interesting to see if it reacts higher over the allotted 1-4 days.
— Andrew Nyquist (@andrewnyquist) July 17, 2014
$RUT to $SPX ratio also records daily buy setup today. Relative underperformance could take a breather soon. Something to watch. $IWM
— Andrew Nyquist (@andrewnyquist) July 17, 2014
The buy setup is referring to DeMark analysis (an exhaustion indicator). Note that this is very short-term in nature (days), but means that the bounce today wasn’t entirely unexpected and that we could see some relative strength vs SPX begin to develop over the near-term. As well, the Russell 2000 tagged 1132 yesterday, a price level representing the 61.8 Fibonacci retracement of the May 15 to July 1 rally.
The chart below adds a bit of historical color to the RUT:SPX ratio. Since the 2009 bottom, the RUT:SPX ratio has seen its daily RSI at or under 30 on just 7 occasions. A short-term rally on the RUT followed each of the previous 6 occasions. However, it is worth noting that 2 of those short-term rallies gave way to another down leg (or lower low). One of those occasions was August 2011, which looks eerily similar in pattern to what we are seeing today. So caution is still warranted. As well, the ratio still has room to move lower based off lows in 2011 and 2012.
Russell 2000 to S&P 500 Ratio Performance Chart 2009-2014
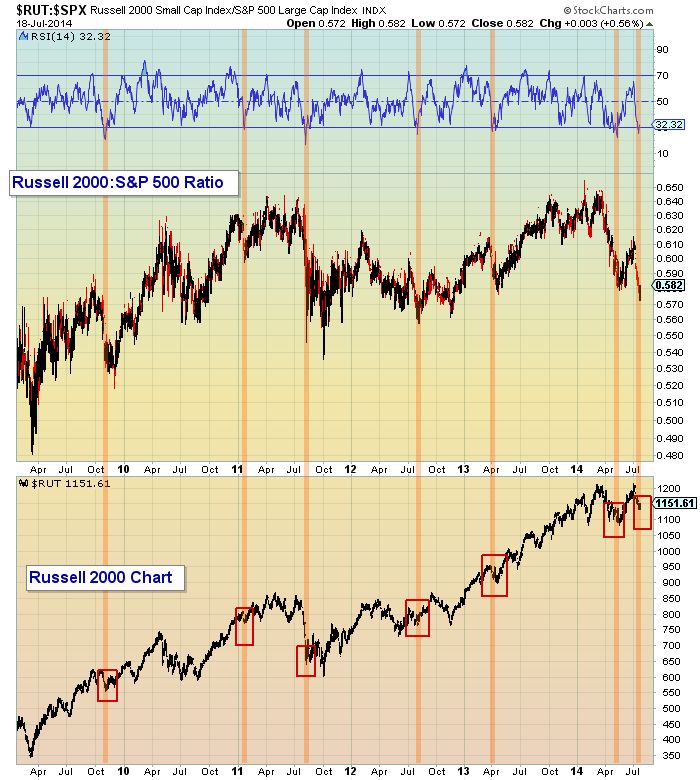
Although the RUT is unlikely to return to its 0.65 outperformance ratio anytime soon, traders should monitor this ratio over the near term… and watch for signs of life out of the Russell 2000.
No position in any of the mentioned securities at the time of publication. Any opinions expressed herein are solely those of the author, and do not in any way represent the views or opinions of any other person or entity.


