![]() By Andrew Kassen What a difference a week makes – again! Sliding aggressively from its 1593 all-time high on 04/11/13 to a 1530.75 low 7 days later, S&P 500 (futures symbol: ES) bulls answered in-kind, rallying over the following 7 days to this morning’s 1582.75 high print. For those keeping score at home, that’s -3.9% in 7 days, followed by +3.3% in 7 more for a net change of -0.6% (incidentally leaving the index -0.6% from its all-time high).
By Andrew Kassen What a difference a week makes – again! Sliding aggressively from its 1593 all-time high on 04/11/13 to a 1530.75 low 7 days later, S&P 500 (futures symbol: ES) bulls answered in-kind, rallying over the following 7 days to this morning’s 1582.75 high print. For those keeping score at home, that’s -3.9% in 7 days, followed by +3.3% in 7 more for a net change of -0.6% (incidentally leaving the index -0.6% from its all-time high).
Now check out the Russell 2000 (R2k): over the same 04/11/13-04/18/13 period, small caps suffered a 5.9% decline, countered from 04/18 to the present by a +4.5% move. In relative terms, R2k’s rebound has been less impressive than the S&P’s; it came from a lower high at 949.8 on 04/11/13 (R2k’s all-time high was installed at 951.3 on 03/25/13); and remains -1.4% off that number at last check.
All told, for position traders, the last 14 days (1o trading days) have amounted to just so many squiggles in a sideways market; but for swing traders, these moves have marked an abundance of opportunity.
Let’s take a closer look at these moves on the Russell. For some points of reference: last week on the day stocks bottomed, we took note a 4% move was quickly setting up; and the following day pointed out the descending triangle had broken higher. The ensuing 4.5% move up from that triangle has staked out the rising wedge you see below (click image to zoom):
Russell 2000 Futures (Contract Symbol: TF) – 30 Minute Chart:
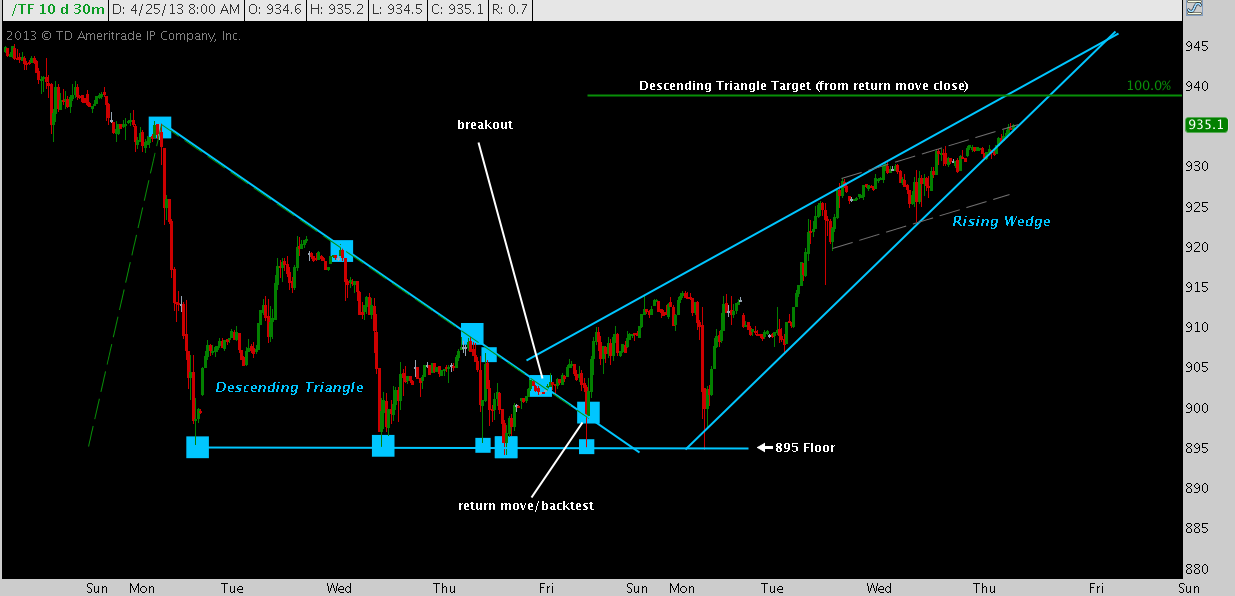
The descending triangle break was not the most resolute: in fact, the index threatened failure of the pattern twice with a twin retest of 895 support twice the initial breakout. But both occasions were swiftly bought; and after the second tap on 895 Monday morning, R2k has hardly looked back. Drawing from the closing low of last Friday’s return move (a more conservative pivot than the initial break some 4 points higher), the descending triangle target of 938-939 has been all-but-achieved.
A modest letdown to curb the enthusiasm before going on. This rising wedge – formidable though it is, covering 4.5% in 5 trading days – is a corrective pattern in an index that has effectively ranged between 895-950 year-to-date. Flipping that position/swing trader coin over, swing traders have witnessed a fantastic 1-week move, yes; but in virtue of their wider view position traders counsel a more sober view: this wedge has done nothing (yet) to change what has become a 3.5 month bull market consolidation.
What else can a wider timeframe tell us? A lot, as it turns out (click image to zoom):
Russell 2000 Futures (Contract Symbol: TF) – 4 Hour Chart:
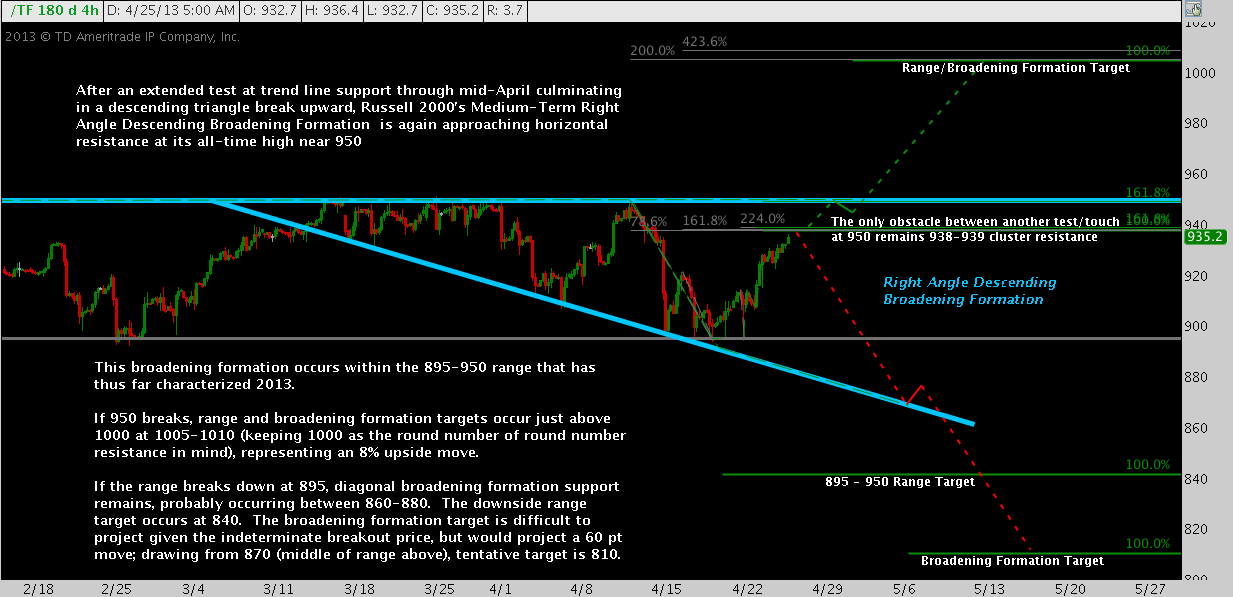
The descending triangle decline and break higher are the latest peak-to-trough-to-building peak inside a Right Angle Descending Broadening Formation.
Thus far in 2013, this pattern (a bit of a mouthful, but easy to recognize and understand) is by far the best thing going to resolve the 895-950 range that has prevailed. An upside breakout over resistance at the 951.3 high is not assured; but it pays to remember (indeed, it would be impossible to forget with countless reminders around) this consolidation is still just a pause-in-trend, even with a 5.9% pullback (it is a “pullback”, after all). The longer-run trend remains up. And that suggests a continuation; right?
Now another caveat: According to Tom Bulkowski’s research (see link above), Right Angle Descending Broadening Formations are “the worst performing pattern in a bull market” with upside breakouts occurring a mere 51% of the time. Though consolidation patterns such as this give the edge to continuations in trend, the edge is negligible. So: Up or down, RADBFs are something of a coin flip.
Not the most compelling setup, staistically; but that shouldn’t and doesn’t stop us from extrapolating some valuable guiding scenarios.
With a move above 951.3, the range and broadening formation patterns both target a concrete move to 1005-1010. Longs at that level complemented by a well-placed stop stand to benefit from a sound risk-managed trade higher.
The downside is trickier. The 55 points range targets 840 on a break below 895 (simple enough); but the broadening formations diagonal support trend line is little help because a break beneath it is a function of time and price (where the line is depends on when you get there). Playing it safe, a break at 860-880 targets the low 800s. A short at or just beneath 895 requires specific caution by ways of technical or volatility-based stop because of how consistently demand has buoyed the index at this level in the last few months. If that level does go, the risk gambit (ideally with a break-even trade in place) becomes managing against the range’s 840 target with some consideration of a broadening formation further down.
Whatever happens, continue to watch See It Market for updates as I cover how these patterns play out in the ensuing days.
Twitter: @andrewunknown and @seeitmarket
Author holds long position in Russell 2000 index futures control (symbol: TF) at the time of publication.
Any opinions expressed herein are solely those of the author, and do not in any way represent the views or opinions of any other person or entity.
: Worrisome to Broader Market?")

: Important Breakout Retest")
