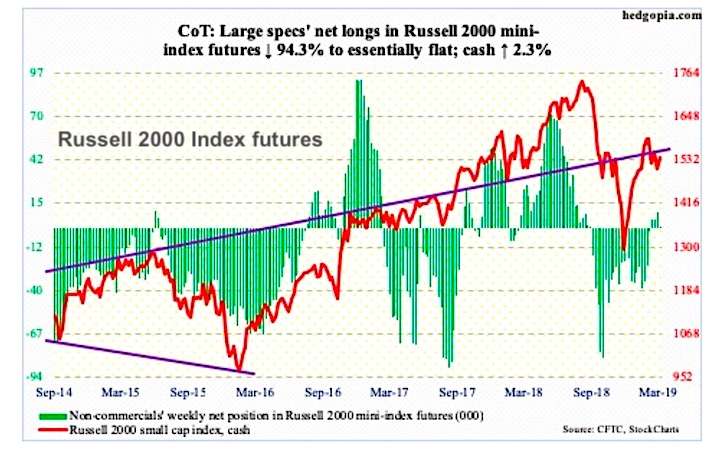
The chart below looks at non-commercial futures trading positions for the Russell 2000 Index.
For the week, the cash Russell 2000 Index (RUT) traded higher by +2.3%.
Here’s a look at Russell 2000 Index futures speculative positioning. Scroll further down for commentary and analysis.
Note that the chart and data that follow highlight non-commercial commodity futures trading positions as of March 26, 2018. This data was released with the March 29, 2019 COT Report (Commitment of Traders).
Note that this chart also appeared on my blog.
With stocks trading higher, volatility has tapered off again, giving life to higher beta stocks like tech and small caps. Will the small caps make a run higher this week? Let’s look at the COT data and technicals to see what’s next.
Russell 2000 mini-index: Currently net long 559, down 9.3k.
The rally in 2019 has seen the Russell 2000 make new highs in late February 2019 before correcting and making lower highs since. This past Monday, the Russell 2000 made lower lows. Not what bulls want to see.
However, bulls did step up and buy that low creating a declining channel. Upside resistance sits at 1550, which may be the path of least resistance near term. Should the Russell 2000 breakout above that level, then we may see a test of the 200-day moving average (then 1600, if bulls are really strong).
Flows were stronger this week. For the week ending Wednesday, the iShares core S&P small-cap ETF (IJR) attracted $20 million and the iShares Russell 2000 ETF (IWM) $358 million – data courtesy of ETF.com.
Twitter: @hedgopia
Author may hold a position in mentioned securities at the time of publication. Any opinions expressed herein are solely those of the author, and do not in any way represent the views or opinions of any other person or entity.

 Testing Important Price Support")
: Cup (and Maybe Handle) Watch")

