Return: Measurement and Uses
In Fiscal Year 2015, companies in the S&P 100 Index, ex-financials, posted Earnings Before Interest and Taxes (EBIT) of $678.9B. In isolation, this number conveys no information regarding the economic performance of the underlying companies. In order to assess economic performance, we need to calculate Return On Invested Capital (ROIC). ROIC, EBIT / Invested Capital (1), puts earnings numbers in the proper context relative to the total capital used to generate them.
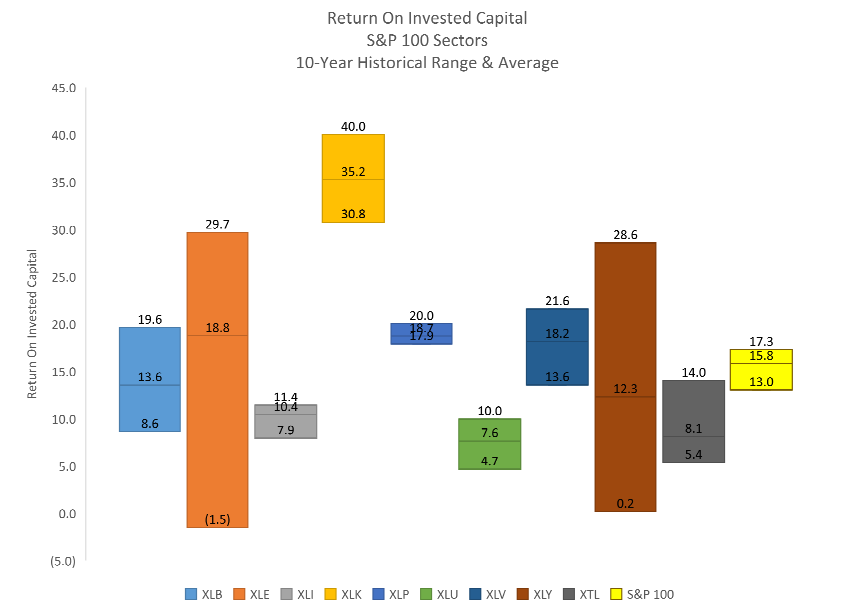
In Fiscal Year 2015, ex-financials, the S&P 100 Index ROIC equaled 13.0%.
By making relative comparisons to history and peers, we can assess managerial performance over time. Managements reinvesting additional capital into the business will increase value only if the returns earned on the additional capital exceed their costs. High and increasing ROIC means that management is very proficient at investing additional capital and transforming this capital into earnings.
The following graph shows the 10-Year historical range, by sector, of ROIC for the S&P 100.
Note that Invested Capital is defined as:
Invested Capital = Total Assets – Excess Cash – (Non-Interest-Bearing Current Liabilities) Excess Cash = Cash, Cash Equivalents, Marketable Securities – (Max (0, Current Liabilities – Current Assets)) We use the average of Invested Capital over the fiscal year in our calculation.
Valuation: Measurement and Uses
The central question to any relative valuation measure is: What is the price of the whole relative to the sum of its parts?
In studying the economics of forestland, Martin Faustmann derived the formula to answer this question. In 1849, he published what is regarded today as the definitive formula for the valuation of forests and land rents (source: Mark Spitznagel, The Dao of Capital, 2013, John Wiley & Sons Inc.). As applied to the valuation of companies, Faustmann’s Ratio is equal to Market Capitalization of Equity / Net Worth.
Note that Net Worth is defined as:
Net Worth = Invested Capital + Cash – Debt – Preferred Equity
Debt = Current portion of long-term debt + Long-Term Debt + Capital Lease Obligations + Non-Current Deferred Liabilities + Other Long-Term Liabilities
By making comparisons to history and peers, we can assess the enthusiasm (or disdain) with which market participants price companies.
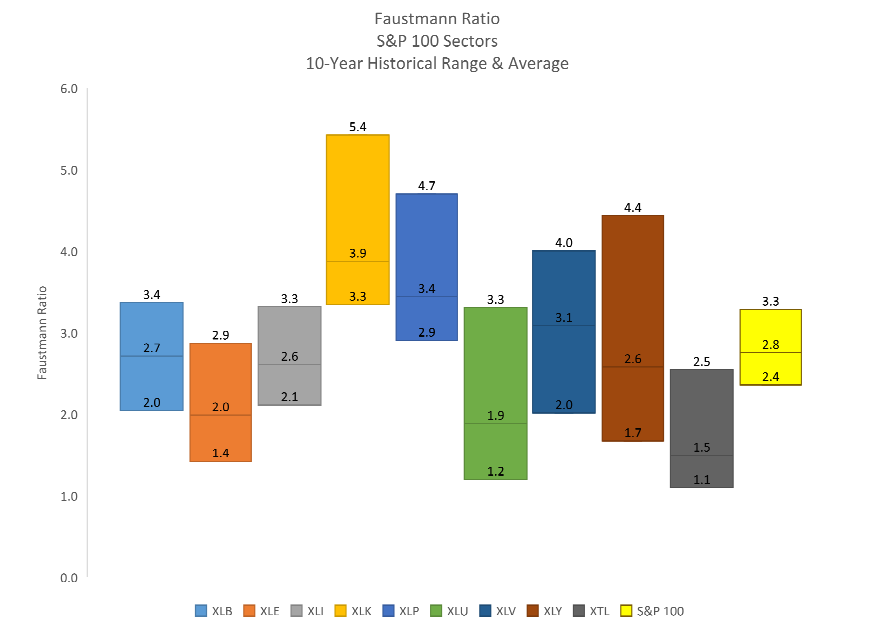
The following graph shows the 10-Year historical range, by sector, of FR for the S&P 100.
Return and Valuation: Visualizing the Two Together
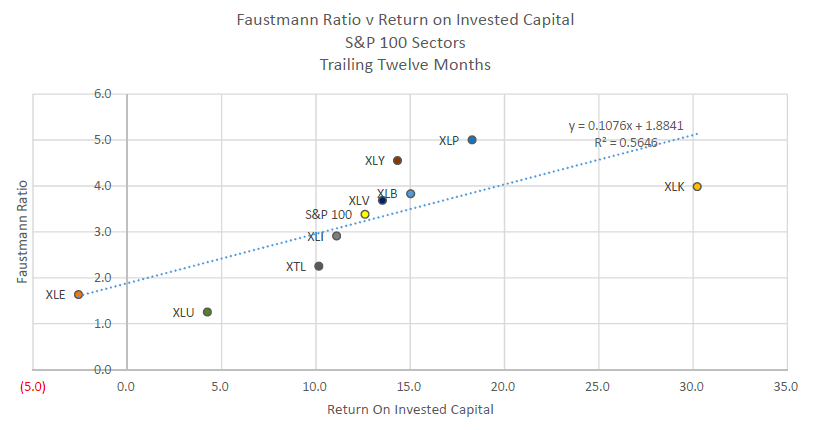
All else being equal, for a given level of ROIC investors should prefer a company with a lower Faustmann Ratio. For a given level of Faustmann Ratio, investors should prefer a company with a higher ROIC. Due to the increasingly incessant short-time-horizon focus of many market participants, this is not always the case.
The following graph plots the trailing-twelve-months (TTM), by sector, Faustmann Ratio versus ROIC for the S&P 100.
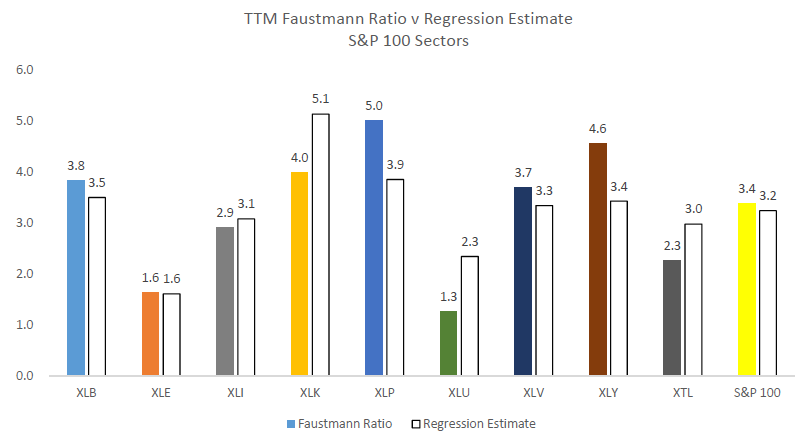
The next graph plots the trailing-twelve-months (TTM), by sector, Faustmann Ratio versus the regression estimate.
Thanks for reading.
Twitter: @Techs_Global
The author may hold S&P 500 related securities at the time of publication. Any opinions expressed herein are solely those of the author, and do not in any way represent the views or opinions of any other person or entity.


