The trend in the broader stock market is higher. The bulls continue to dance and the only think most long-only investors can complain about is stocks or sectors that are underperforming or the ones they missed out on.
Everyone seems fat and happy, with some that are fatter and happier.
Today’s chart focus falls it he prior of those to investor categories. While the Real Estate Sector ETF (XLRE) is rebounding, it is also marginally underperforming. While XLRE is poised for new highs, it also looks like those new highs could come with divergences (unless momo kicks in big time). So what’s going on? It’s a battle of timeframes…
Note that the following MarketSmith charts are built with Investors Business Daily’s product suite.
I am an Investors Business Daily (IBD) partner and promote the use of their products. The entire platform offers a good mix of analysts, education, and technical and fundamental data.
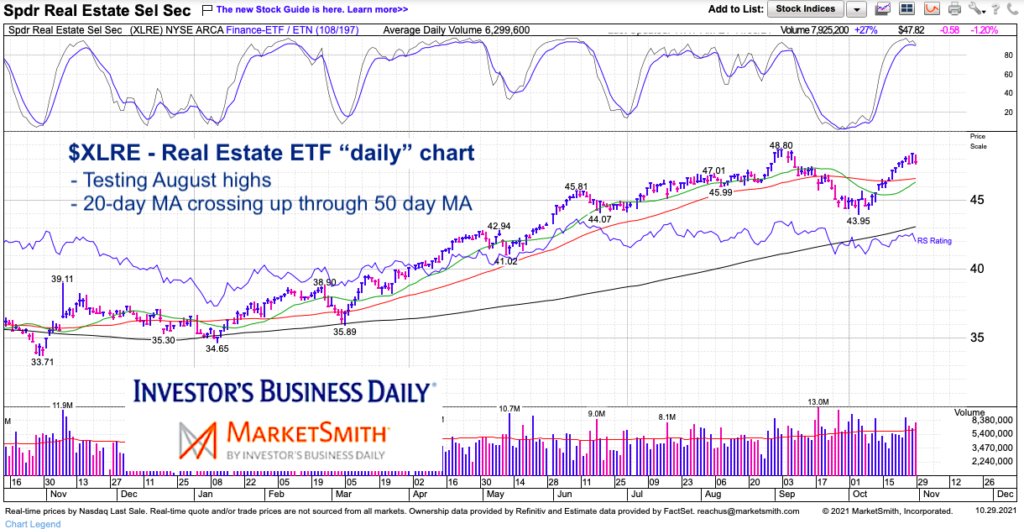
$XLRE – Real Estate Sector ETF “daily” Trading Chart
The daily chart is near-term bullish with the 20-day moving average poised to cross up through the 50-day moving average. Though XLRE continues to lag, new highs are likely.
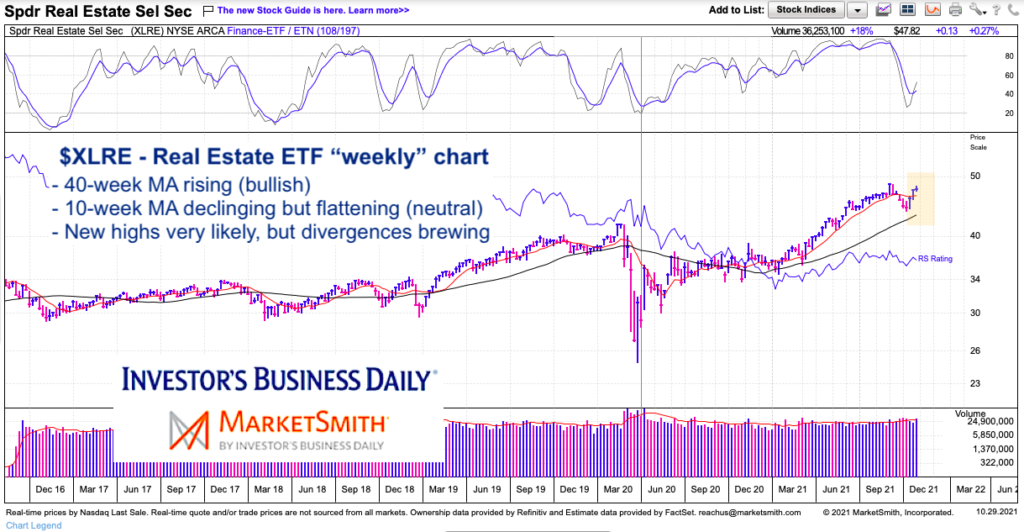
$XLRE – Real Estate Sector ETF “weekly” Trading Chart
On the weekly chart, we see that while the broader trend is still “up”, we have a potential divergence with momentum / relative strength. This warns that unless XLRE kicks it into gear, new highs in a lagging sector may get sold.
Twitter: @andrewnyquist
The author may have a position in mentioned securities at the time of publication. Any opinions expressed herein are solely those of the author, and do not in any way represent the views or opinions of any other person or entity.


