 Though it hasn’t unfolded quite so perfectly as the Russell 2000, the S&P 500’s (SPX) trend higher throughout 2013 is still a near-masterpiece of symmetry and momentum. Not since 1995 has the benchmark equity index exhibited such an unflappable and linear advance, full of long, placid measured moves higher that never fail to ultimately reach their targets.
Given its almost unbelievably straightforward trajectory, you might rationally expect the constituent legs making up 2013’s rising trend to cover similar ground. And you’d be correct: the price and time covered by each of these legs is incredibly similar. In fact, every single major leg higher (i.e. preceding a pullback of 2% or greater – remember: it’s 2013) breaks out into one of three nearly identical sets.
S&P 500 (SPX): 2013 Year-to-Date – The Yellow Set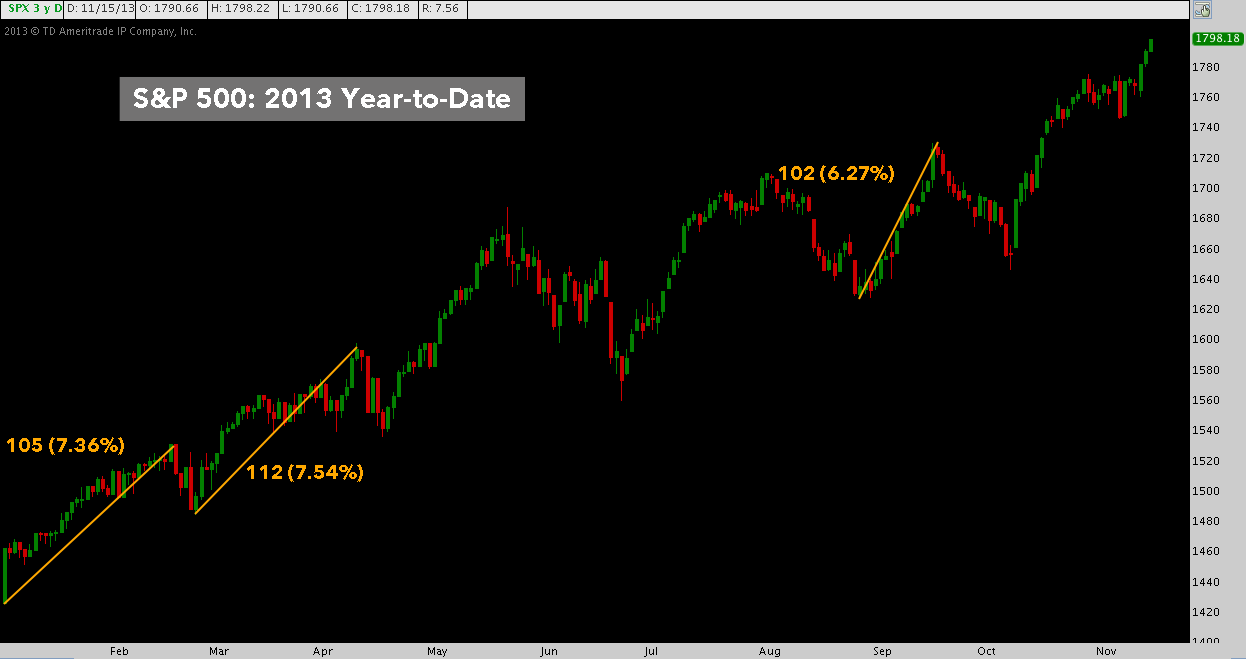
3 legs – the first two comprising a flawless measured move up – of almost identical range.
Not bad. Now check out the next group:
S&P 500 (SPX): 2013 Year-to-Date – The Blue Set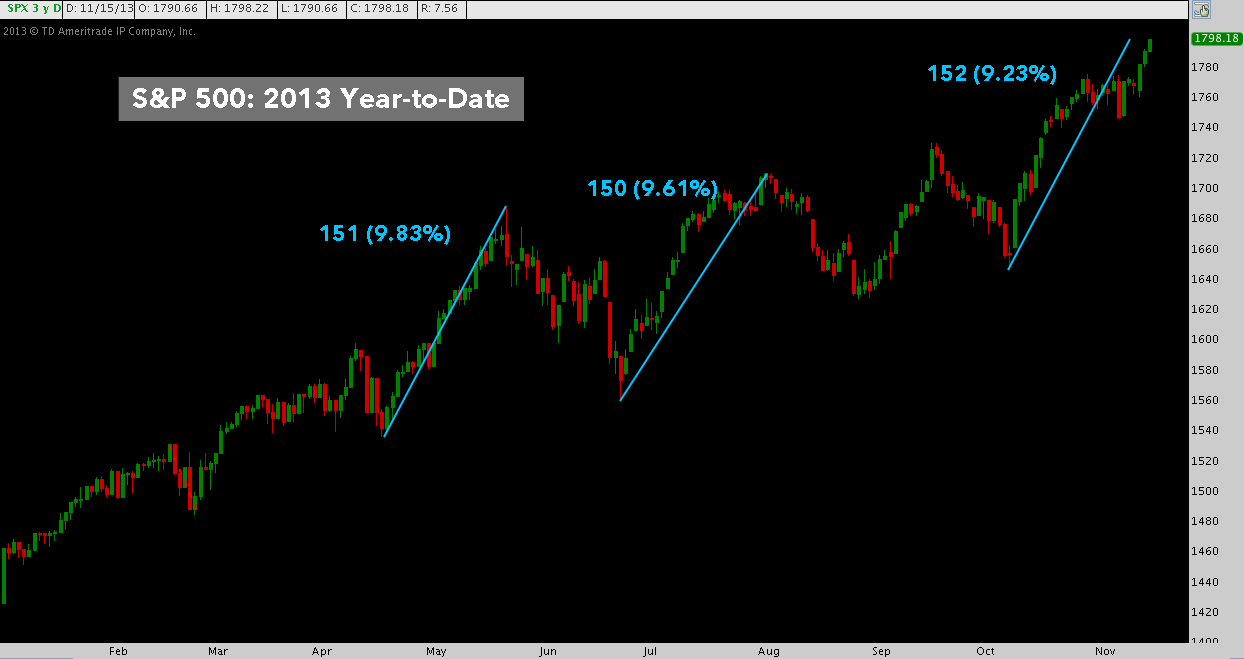
2 legs – the first preceding a correction of over 7.5%, the second preceding a correction of almost 4.9% – measuring within a point of one another. The third leg measures off October 9th’s low to Friday’s close.
Not to be outdone, here’s the final set:
S&P 500 (SPX): 2013 Year-to-Date – The Gray Set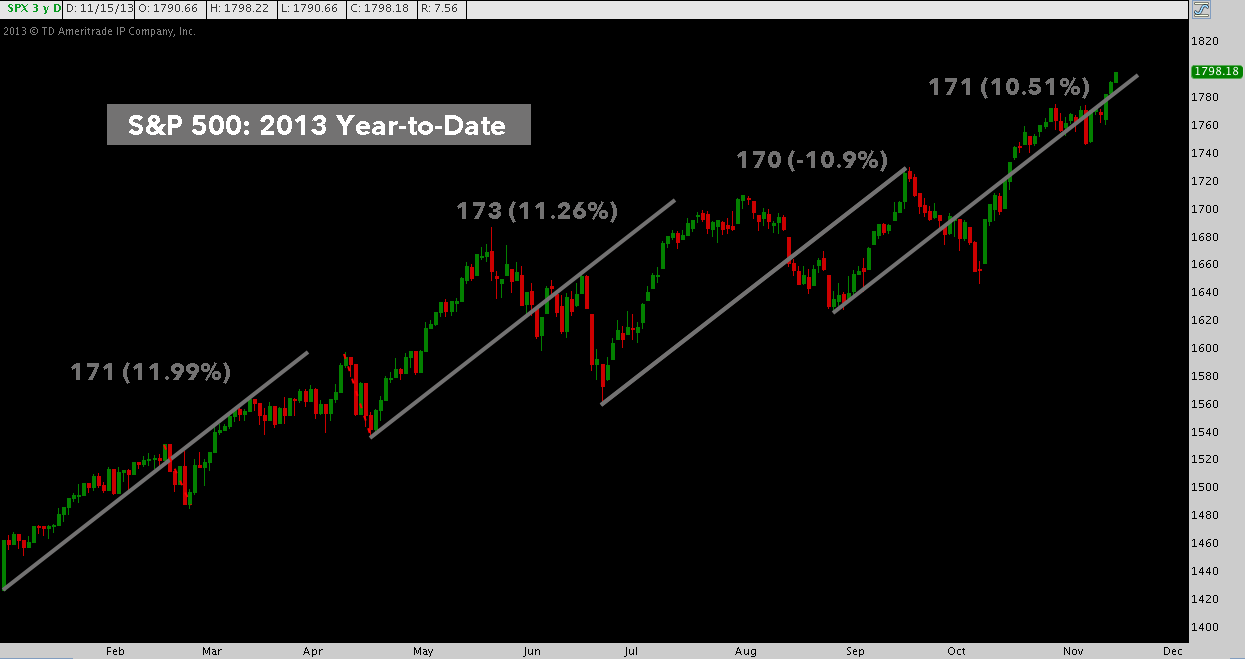
3 legs, each measuring within a couple points of the other. As with the blue set, the fourth and last in line here hit its own measured target with Friday’s close.
The pullbacks that have followed these legs haven’t been symmetrical. Muted, shallow and furiously bought, yes; but not symmetrical. Taken together with the legs preceding them, though – and assuming the year’s consistency continues – they provide an idea of what to expect next. The last chart below combines all of these elements, showing some reasoned S&P 500 pullback targets off of Friday’s close, given its possible (probable, if the measurements hold up) completion of the latest blue and gray legs.
S&P 500 (SPX): 2013 Year-To-Date – S&P 500 Pullback?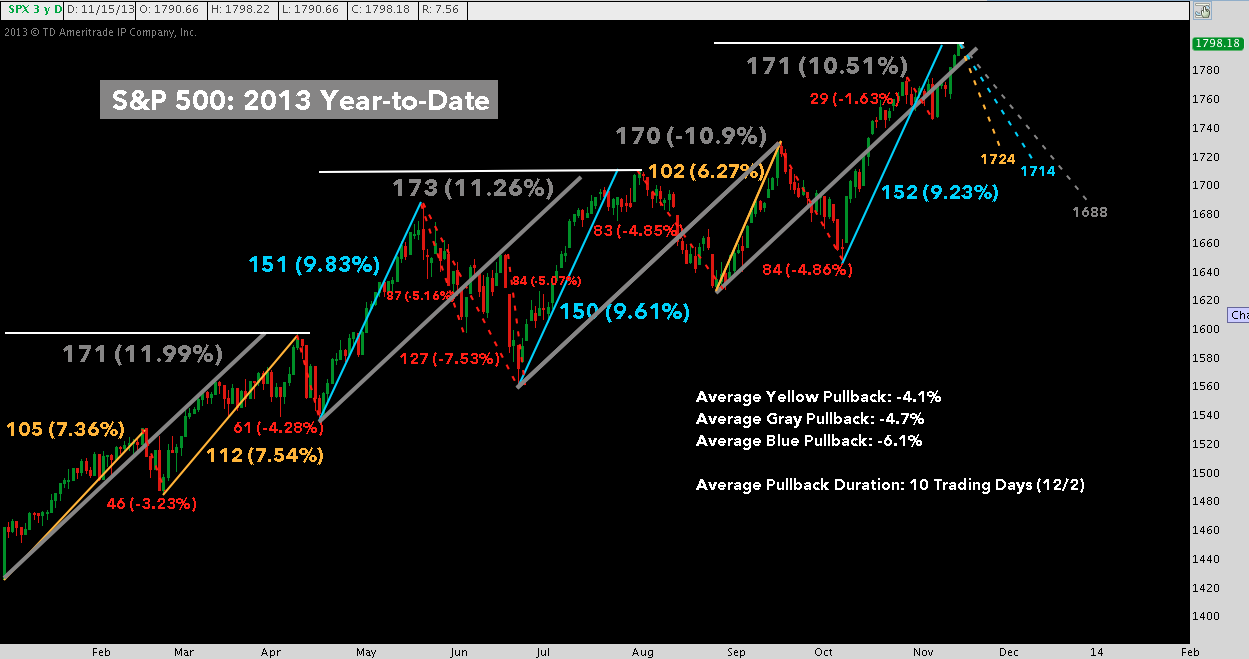
Twitter: @andrewunknown and @seeitmarket
Author holds net short exposure to Russell 2000 at time of publication.
Any opinions expressed herein are solely those of the author, and do not in any way represent the views or opinions of any other person or entity.

: Creating Bullish Divergence?")


: Creating Bullish Divergence?")

