 By Andrew Nyquist
Yesterday was a rough day for the financial markets, as the leading indices gapped down 3 percent on heavy volume and closed on the lows of the day. The European debt crisis and MF Global investment debacle took centerstage and short sellers capitalized on an overbought, uncertain market. But the uncertainty cuts both ways. This morning, the jobs number came in slightly better than expected and the markets quickly moved higher in an attempt to take back some of the recent losses. From overbought to oversold in a matter of days… another sign that the markets remain jittery.
But we already knew this. Heck, the marketplace has been uncertain for some time. And this makes learning particularly difficult for retail investors. But investors have to dig deep, as learning is the name of the game and the market action is always trying to tell us something.
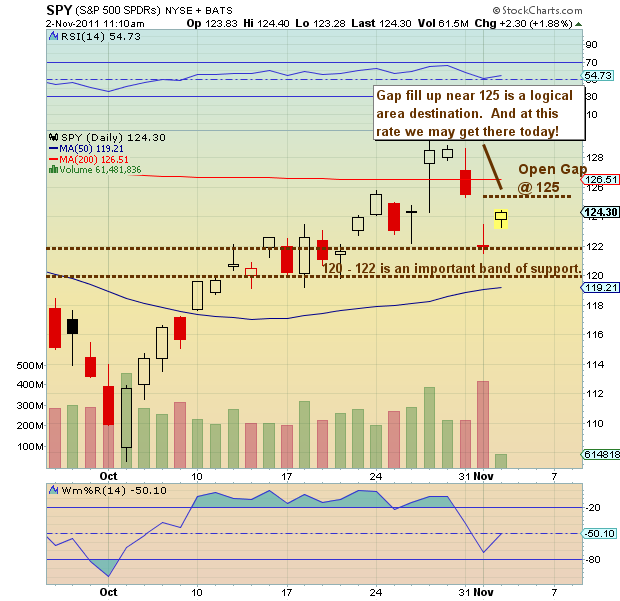
Furthermore, a closer look at the charts reveals two important take aways: 1) The S&P 500 retested 1220 yesterday, an all-important support level; important support and resistance levels rarely give way on the first attempt. Note also that 1220 is roughly the mid-point of this years high and low and it represents the April and November 2010 highs. 2) Yesterday’s disaster left a large gap on the charts. A gap is created when the price of a security opens higher or lower than the previous days close. A gap is considered to be filled when the security returns to that price. Although gaps may not be filled right away, it is good to make a mental note that they tend to act like magnets. And including yesterday’s drop, the market was off over 6 percent in a matter of days, which led to today’s bounce back… which has found its way higher towards the gap.
Below is a chart for the SPDR S&P 500 (SPY), an ETF that tracks the S&P 500. This serves as an illustration to the points made above and offers some technical analysis 101. Note that the 122 level is similar to 1220 on the S&P 500.
———————————————————
Your comments and emails are welcome. Readers can contact me directly at andrew@seeitmarket.com or follow me on Twitter on @andrewnyquist. For current news and updates, be sure to “Like” See It Market on Facebook. Thank you.
No positions in any of the securities mentioned at time of publication.
Any opinions expressed herein are solely those of the author, and do not in any way represent the views or opinions of his employer or any other person or entity.


