 Given the delicate context the broad market up-trend finds itself in, this morning marked one of those rare occasions in which I check the basket of instruments I analyze against commonly-used moving averages to see how things are faring. Looking across baskets of equity indices and ETFs, bonds, currencies and commodities I came away with a lot of observations; but for equities they were each a slight variation of something much like this:
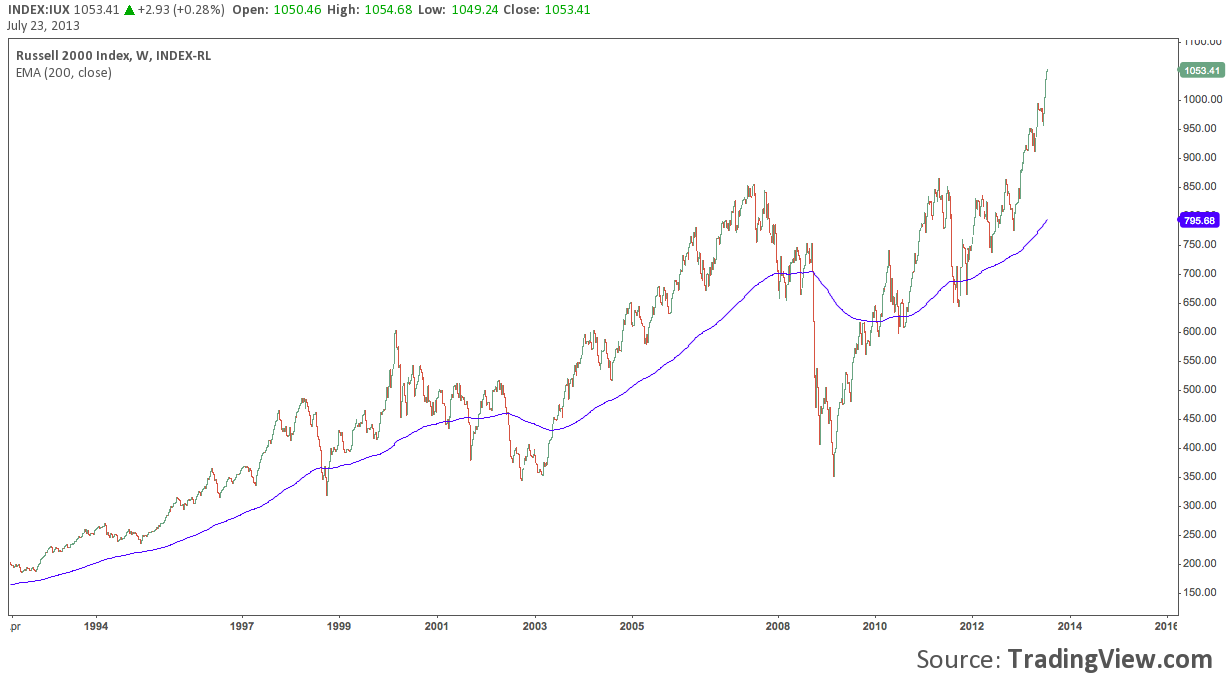
“The Russell 2000 is very far above its 200-Week Exponential Moving Average”
Blunt and vague back-of-the-napkin observations like this are highly common (what am I saying? they’re all-pervasive!) and highly useful analytical short-hand for developing and conveying broad market opinions. Check out a chart of the Russell 2000 (Symbol: RUT; displayed here as IUX) and I think you’ll agree the comment above is more-or-less beyond dispute (click image to zoom):
You don’t have to look very far to find cursory conclusions like this used as a basis for putting real money on the line; or cited as a compelling justification for why an erroneous (or merely early; but that’s only evident in hindsight) market call is about to turn around. In any market context defined as a mature, momentum-driven trend – such as the current one – market opinions like this are among the most common uttered in skepticism.
And not for no good reason. Over short and medium-term time frames, markets are generally mean-reverting. What goes up generally comes back down, at least fractionally. There’s nothing wrong with these raw market “feels” left to themselves; but pressed into the service of informing or guiding capital allocation decisions, a positive outcome is more attributable to luck and product of latent behavioral bias than real analytical acumen. All things considered, that adds up to a fiction that is worse than a loss.
How do we shore broad market opinions and observations like this up?
This may seem painfully evident (it’s not), but: ensure that you thoroughly understand what’s being claimed (whether by others or even yourself).
Take the above statement as an example: “The Russell 2000 is very far above its 200-Week Exponential Moving Average”
Note the operative phrase here – what gives this market opinion its meaning – is “very far above”. Left to itself, this is actually a fairly vacuous phrase.
1) What does the speaker mean by “very far above” this context? What should the phrase mean given the instrument’s history? Are the claim made and market history compatible?
2) “Very far” on an absolute (percentage); or a relative (points) basis? Both?
and
3) The phrase “very far above” suggests the Russell 2000 rarely deviates so far from its 200-Week EMA. How long can this continue? And most importantly, “what follows this condition?”
In short: what does this claim about the Russell 2000 really mean? And once you figure that out, what is the info worth?
Taking the 200-Week EMA For A Spin
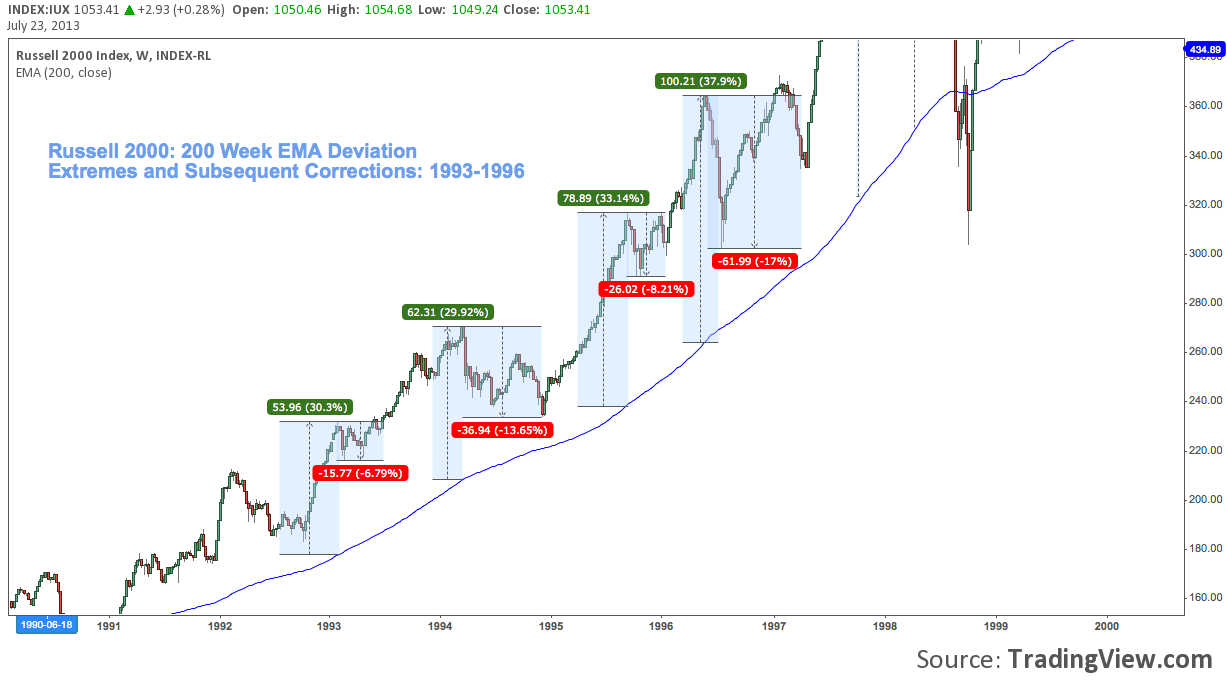
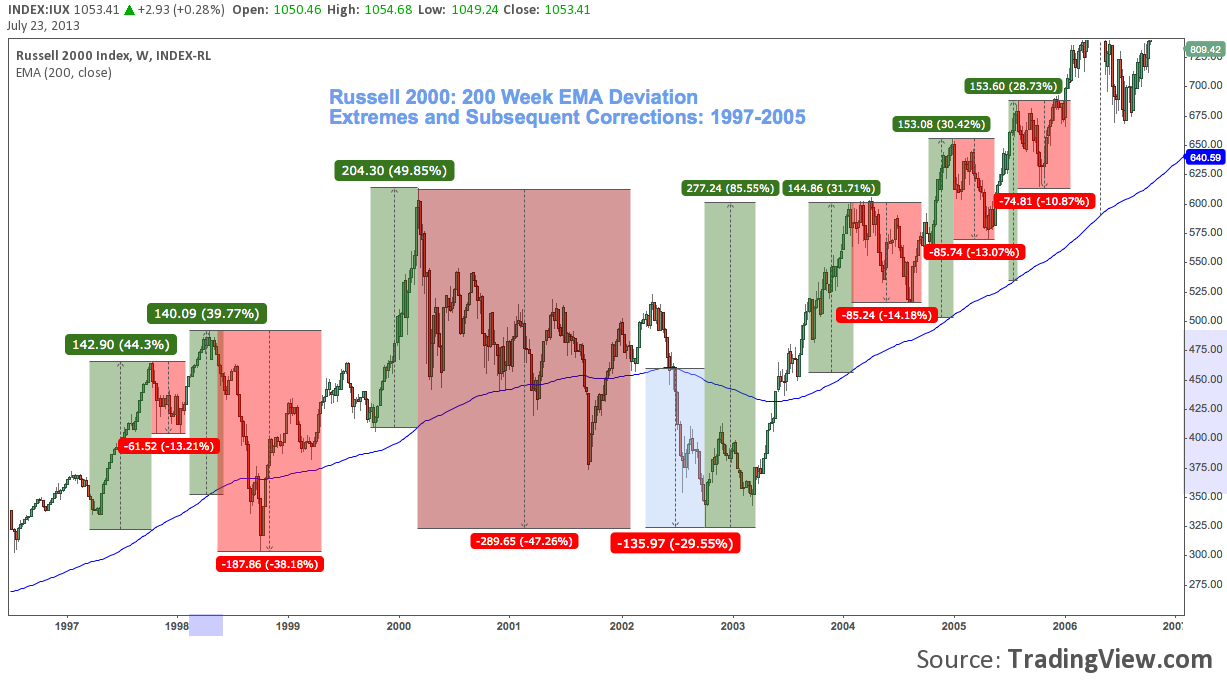
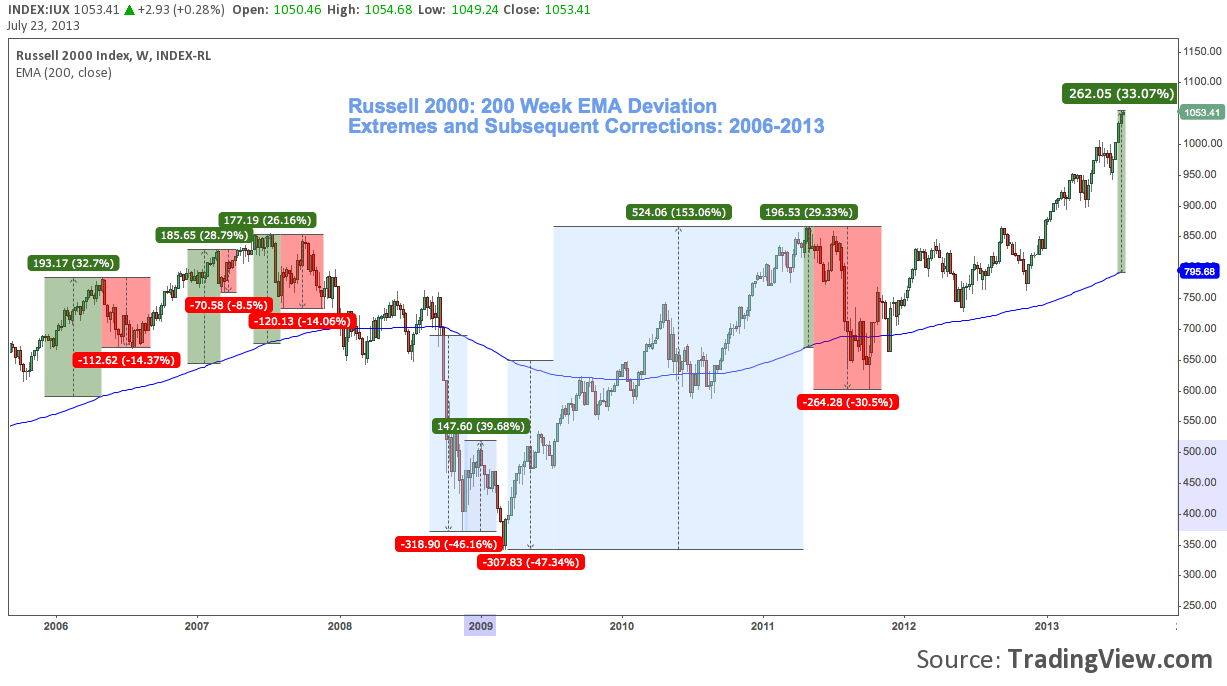
To answer these questions, I chose 17 major swing highs and lows from the last 20 years (1993-2013) of weekly price data as sample data to test against, as displayed in the three charts below. Those ranges with green headers measure the index’s distance from the 200-week EMA; those with red headers measures distance to the subsequent local price trough (except in extreme cases to reduce outlier skew, the lowest low prior to establishment of a new high). Note that on the two occasions where price made a material break beneath the 200-week EMA (2002 and 2008-2009) the deviation is marked red, and distance to the subsequent price peak marked green.
The Results:
- The average deviation prior to correction across the 17 occurrences measures +35.06%; expressed in points: +162.
- The median deviation: 31.71%; expressed in points: +153
- The average correction as described above across the 17 occurrences measures -31.06%; expressed in points: -144.
- The median correction: -14.18%; expressed in points: -86.
With that basis of comparison in mind, consider the current deviation: +33.07%, or 262 points.
Some Study-Specific Conclusions:
1) “Very far above” the 200-week EMA can be reasonably defined as any occurrence +35.06%. The Russell 2000 is close, but in contrast to the market opinion expressed it’s not quite there yet . The median deviation of +31.71% suggests the average is top-weighted by a few outliers; and since the Russell is above this figure, we conclude the index’s current move qualifies as an “outlier”.
2) Comparing deviations or corrections in points is interesting, but only as market trivia unless it’s a pretty concise time frame – otherwise it’s comparing apples and oranges. The Russell is currently “very far above” the 200-week EMA on a point basis; ranking a fairly rare 3-of-18; but actually middle-of-the-pack on a percentage basis at a mostly unremarkable 8-of-18.
3) How long can this continue? Since the market topped in 2000 almost 50% above the 200-week EMA, this is the furthest the Russell 2000 has deviated from the average in percentage terms. In points, the current move is the furthest the index has ever deviated above the average (the 2008 and 2009 troughs were considerably deeper on both bases).
This is a simple study, true; but it does produce some disproportionately powerful conclusions. As we’d expect, its conclusions are of the same general inclination as our original claim; but deviate in some significant ways that a quick peek at the 200-week EMA just doesn’t pick up.
What Does It Matter?
Most importantly: What’s it worth? Honestly, not as much as the original opinion and first chart seem to imply. That may seem anticlimactic; but then, that’s the point. This “simple” market claim isn’t so simple, after all; or quite so valuable as some may assume. That’s often the case; which is all the more reason to question your market convictions. But here are a few takeaways:
- We’re Well Into a Historic Rally. The early 1990s and early 2000s were magnificent up-trends that featured some huge deviations from the 2oo-week EMA; and the current one (i.e., since 2009) keeps up with both of them.
- Big Deviations Often Precede Big Adverse Moves. Only 1996-1998 and 2000 (4 of 17 occurrences) really exceeded the current 33.07%. But the average decline for each of these was almost -29% peak-to-trough (and yes, still well into double digits without the dot-com bust outlier). In other words, this upside comes with a huge subsequent price. -29% on the Russell from here is around 740; to put it in more familiar terms, that’s a S&P 500 (Symbol: SPX) at 1200. This isn’t a suggestion the bullish Supercycle ongoing for most of the last hundred years is drawing to an end; just a reminder this kind of pain is normal and comes even amidst periods of great prosperity.
- Test Your Observations: But Only Develop and Deploy the Good Ones. In line with an earlier point, statements such as “X is ‘very far’ from Y are great for general perspective, which is often more than adequate; but, these market opinions are also crude, ill-formed, and not well thought-out – at all. That’s okay, as far as it goes. However: “analytical rigor” entails hard work: taking money out of the market with consistency doesn’t come easy and isn’t accomplished with superficial or untested ideas. Development of mere market opinion (which everyone has) into actionable trade theses – even if there’s no hint of discretion and it’s all about system development for you – necessarily involves research and your sustained effort. As a wise man once said, “examine everything carefully; hold fast to that which is good”.
Twitter: @andrewunknown and @seeitmarket
Author holds a short Russell 2000 position at the time of publication.
Any opinions expressed herein are solely those of the author, and do not in any way represent the views or opinions of any other person or entity.

: Showing Some Signs of Emerging Strength")
