Every day of our lives, we learn and experience new strategies, opinions, and patterns that have to be incorporated into our personal belief systems.
Sometimes, facts are simply rejected because they contradict our philosophies.
Other times, facts seem to be compatible with our beliefs and confirm that we are on the right track.
However, sometimes what served us well before, may not serve us well now.
The Fable quoted in the photo represents that these old beliefs can become the raft that we carry around even if we do not need it anymore.
How does ths parable apply to the current market?
We are in a market situation that hyperfocuses on whether or not Central Banks will add liquidity.
In fact, on any given day, news stories on rates both globally and in the domestic US drive the market.
For example, Chinaposted their best gains in weeks on news local governments will have more room to spend on infrastructure, offsetting Trump’s latest threat of more tariffs.
That gave the U.S. markets an early boost.
Meanwhile in the U.S., the market holds its breath on whether or not low inflation expectations and some economic statistics that show a slowdown, will coerce the Federal Reserve to lower rates.
Furthermore, to the Fable’s point, that liquidity boat crossed the water during the housing crisis in 2008.
QE ended in 2015.
Today, Trump called for more QE after the last jobs report.
That makes us wonder if dragging QE around on land will become moot or worse, counterproductive?
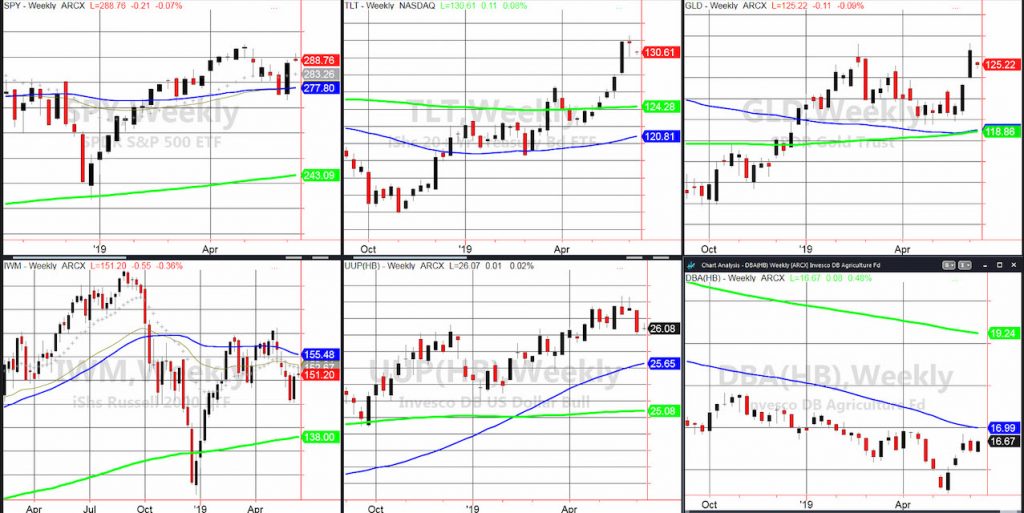
Some weekly charts to look at.
Top left is the S&P 500. Last week, SPY loved the idea of lower rates. Today, it stopped running up and turned negative.
The 20-Year Bond TLT chart is in a bullish holding pattern. Exactly what we would expect right now.
The gold chart, also in a bullish phase, indicates how stumped folks are on the inflation metrics versus the expectation of increased inflation should the Fed lower rates.
Bottom right, the Russell 2000 IWM is now under the high from last week after stalling at resistance. It looks completely different than SPY. It’s saying QE will not work. That is worrisome.
The dollar chart UUP, looks like gold in a way. Paused and confused.
Finally, the agricultural ETF DBA, looks like it has bottomed and is getting ready to clear the 50-WMA (blue).
Put this all together, and it seems that the instruments to gain from any more QE are commodities. The talk sure has not helped IWM-the Granddaddy of the U.S. economy.
What looks very likely right now, is that the lifeboat that floated us out of recession in 2008, is the same lifeboat that will harness us back into recession should the Fed carry it on land.
Every Tuesday and Thursday, I will be on KKOB radio at around 6:15 PM mountain time (8:15 PM EST) to discuss markets and market news. https://www.iheart.com/live/770-kkob-5411/
I’m happy to announce that my book, “Plant Your Money Tree: A Guide to Growing Your Wealth”, made it to BookAuthority’s Best New Wealth Books:
https://bookauthority.org/books/new-wealth-books?t=ipp94p&s=award&book=153812257X
The book is available for purchase on Amazon.
S&P 500 (SPY) – 287.00 the 50-DMA is super pivotal.
Russell 2000 (IWM) – 152.75-153.35 is where the resistance lies. 151.65-the high 2 weeks ago-is pivotal and 149 the support.
Dow Jones Industrials (DIA) – 260.12 the ever so important pivotal level.
Nasdaq (QQQ) – After running up over it, this closed again under 183.59 the 50-DMA. And, if this cannot hold 179.75, look for a move back down to around 175.
KRE (Regional Banks) – 51.40 support. Overhead resistance at 53.50
SMH (Semiconductors) – 105.50 important support to hold. 109.43 the 50 DMA.
IYT (Transportation) – Ran right into the EMA resistance at 186.50. 185.75 pivotal and 180.85 support.
IBB (Biotechnology) – 103.15 pivotal resistance for now.
XRT (Retail) – 42.35 the major resistance with now, 40.00 big support.
Twitter: @marketminute
The author may have a position in the mentioned securities at the time of publication. Any opinions expressed herein are solely those of the author, and do not in any way represent the views or opinions of any other person or entity.
: Creating Bullish Divergence?")

 and Semiconductors (SMH): Concerning Price Pattern?")
 and Semiconductors (SMH): Concerning Price Pattern?")


