In real time, growth in productivity is just the residual difference between input (labor) and output (GDP) growth. A sustained up-turn in the trend in productivity would suggest a higher growth potential for the economy than is widely forecast.
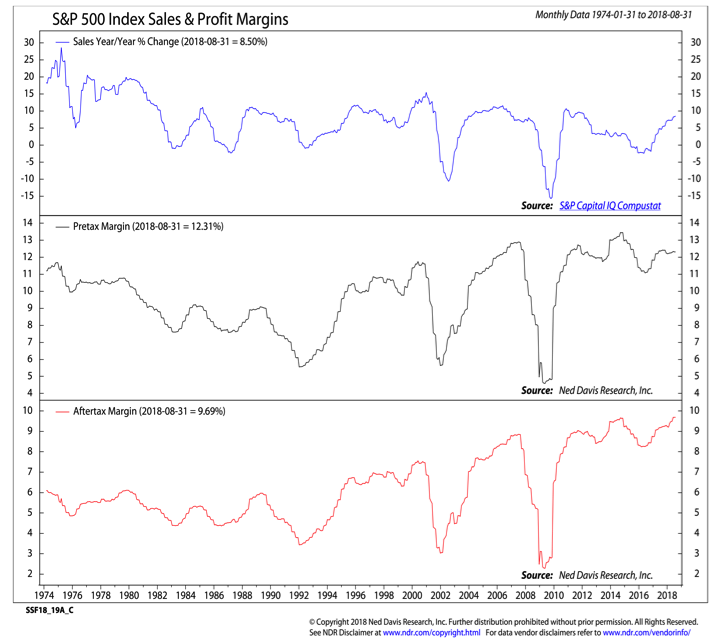
Sustaining the recent uptick in economic growth will help support continued corporate top-line revenue growth. This could be an increasingly important source of bottom-line earnings growth. Profit margins have been near record levels, but that could soon change if the wage growth mentioned previously continues to build.
Add in higher interest and commodity costs and it would not be surprising to see margins start to come under pressure. Commentary on margins will likely be closely scrutinized as the market digests third-quarter earnings reports.
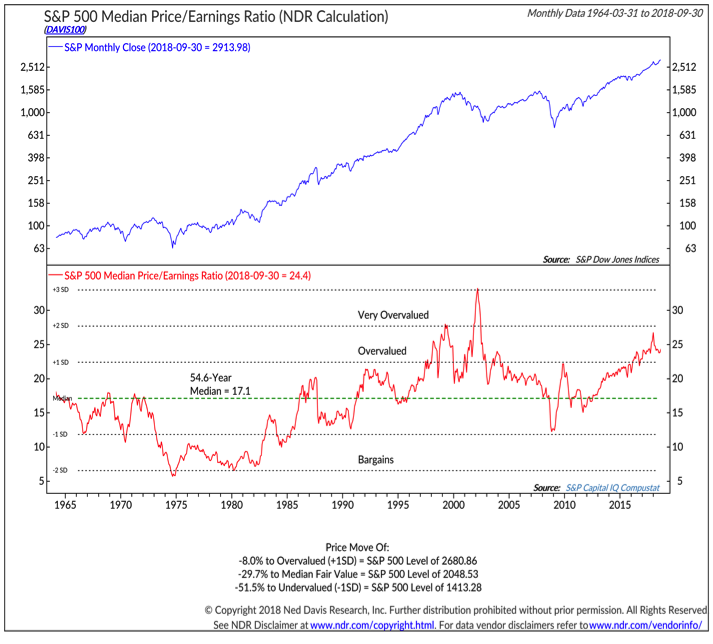
Valuations remain Bearish. Strong earnings growth in the first half of 2018 (at a time in the cycle when growth would typically see a meaningful slowdown) helped valuations improve even as stock prices rallied.
The median P/E ratio for the S&P 500 reached its highest level since 2002 in January as the S&P 500 began the year with a surge to new all-time highs. The P/E ratio retreated as stocks pulled back in the wake of the January peak and remained well off its January peak even as the S&P 500 moved to new highs this summer. This improvement is encouraging evidence that valuation excesses can be relieved at least in part by earnings growth and not just price corrections. However, even with this improvement, valuations remain elevated by most any measure.
Sentiment overall continues to be Neutral. Short-term sentiment indicators point mostly to elevated, though perhaps not excessive, optimism. One exception to the evidence of optimism comes from fund flow data showing a persistent outflow from equity funds. Historically this has been bullish for stocks. While the margin investors are shifting assets away from equities, on a cumulative basis, household exposure to equities remains elevated (and exposure to cash remains near historical lows). There is strong inverse relationship between household equity exposure and forward stock market returns. Elevated exposure to equities has tended to be followed by sub-par stock market returns.
Seasonal patterns for now remain bearish. From a quarterly perspective, the focus we move into the fourth quarter is two-fold:
- Strength over the first three quarters of the year tends to be followed by above-average gains in the fourth quarter.
- The market is moving from the weakest two-quarter stretch of the Presidential Cycle and into the strongest three-quarter stretch of the entire cycle.
Combining those two quarterly perspectives suggest seasonal factors are shifting from headwind to tailwind. Before getting carried away, we would call to mind that October has had more 1% moves than any other month. This suggests we could be on the cusp of an overdue up-tick in volatility.
For now, however, we are holding off on upgrading our view on the seasonal patterns. It is coming, but just not yet. Support for this delay comes from a look at the ratio between small-caps and large-caps, which follows a seasonal pattern of its own. While the pattern of pre-midterm election weakness out of small-caps is holding true to form, the current cycle has been slower in developing than previous cycles. We will be watching this as we move into the fourth quarter and renewed strength in small-caps could be evidence that seasonal patterns in the current cycle are turning more positive.
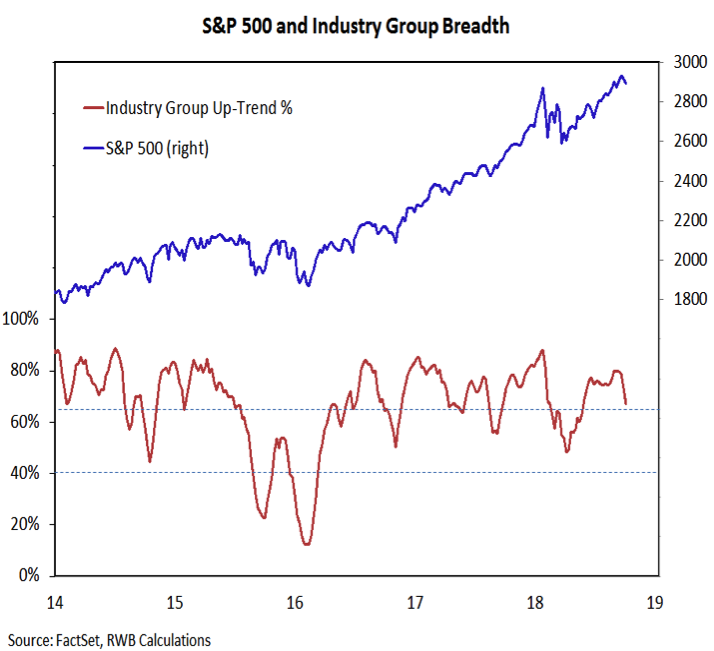
Breadth is neutral, but it is becoming harder to look past the ongoing deterioration in the market internals. New highs on the U.S. indexes have not found support within the U.S. market or among the overseas equity markets. The daily new high lists have contracted, the new low lists are expanding and the percentage of stocks trading above their moving averages has not confirmed index-level strength. Our primary breadth indicator looks across the capitalization levels to gauge industry group trend strength. The percentage of industry groups in up-trends has not confirmed the new highs on the S&P 500 and a potentially meaningful divergence is emerging. While holding at breadth at neutral, it appears closer to breaking down (shifting to bearish) than breaking out (shifting to bullish).
Sector relative strength trends are showing some shifts in leadership. Technology is slipping in the rankings as its trend has deteriorated. Taking over the lead has been the Health Care sector. Consumer Discretionary has seen some short-term deterioration but remains in the leadership group for now. Industrials climbing back into leadership is seen as evidence that the economy remains on firm footing. Industry group shifts have produced an expanded Communication Services sector (primary the Media group from Consumer Discretionary was merged with the Telecommunications sector). We have also broken out the Real Estate sector from Financials (a move that was officially made some time ago) as interest rate moves may lead to increasingly divergent trends in those two sectors.
Sector Ranking CHART
Twitter: @WillieDelwiche
Any opinions expressed herein are solely those of the author, and do not in any way represent the views or opinions of any other person or entity.


