After the worst weekly sell-off in years, let’s take step back and put the recent stock market correction into perspective. First off, as of a week ago, the S&P 500 was about a percent away from a new high, and as of Friday’s close it is more than seven percent away. That happened fast! And considering today’s morning trade, the S&P 500 has now dipped into correction land (it’s been volatile so we’ll see how the day closes out).
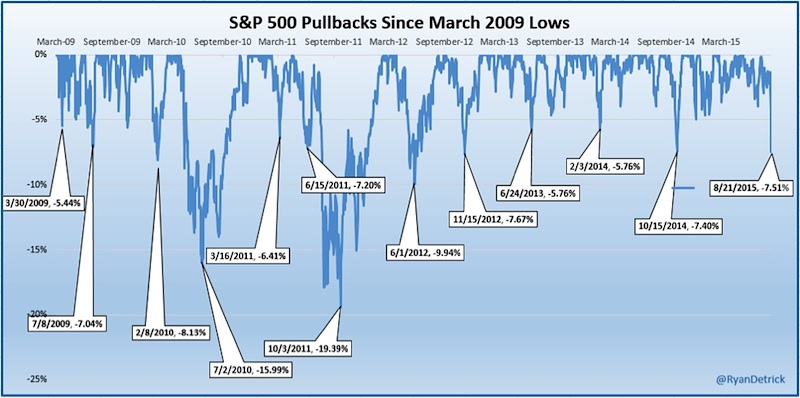
Here’s a chart I shared on Twitter & StockTwits last week and it was very popular. I share a lot of charts and a lot of times I see what you guys like the most, then write about it. The S&P 500 is still within a normal market correction of the recent all-time high. Going back to 2009, we’ve seen this many times before.
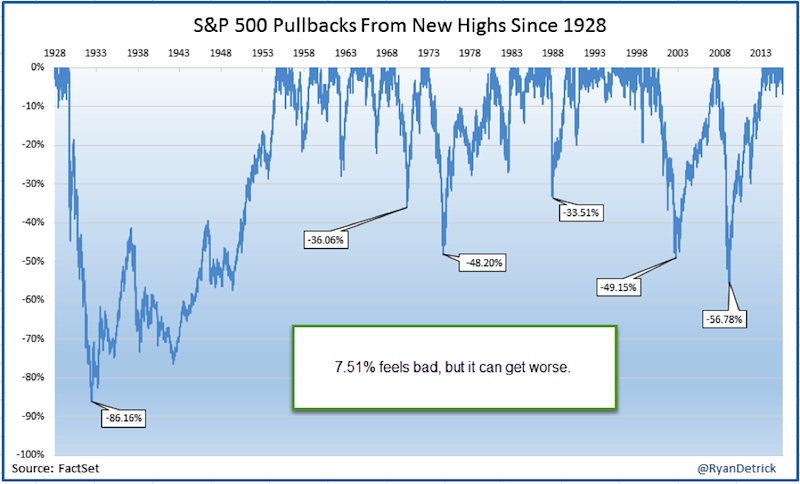
Here’s a longer-term look at the stock market since 1928. Again, nothing too out of the ordinary quite yet.
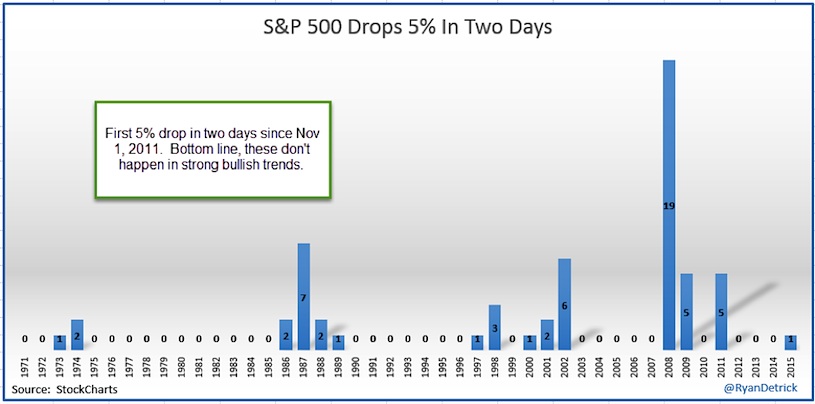
What is concerning is just how quickly it has happened. The S&P 500 was down 5% over two days for the first time in four years. And now today. Bulls markets tend to be slow and steady. Check out the years these tend to happen; they are not necessarily good bullish memories for stocks.
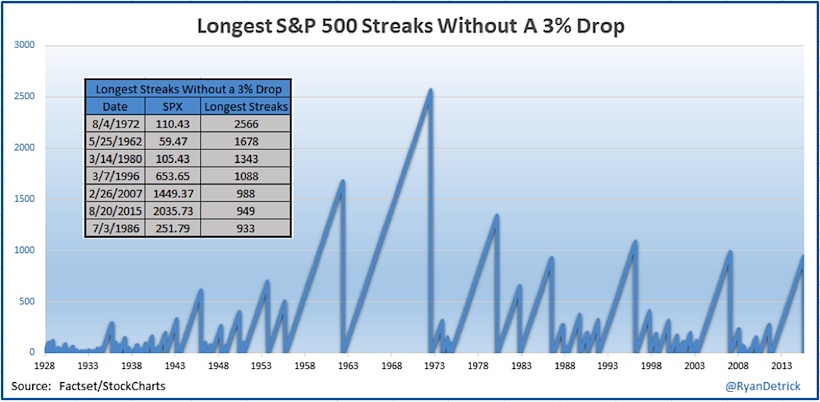
Not to be outdone, the S&P 500 dropped more than 3% on Friday for the first time in 949 days. That was the sixth longest streak ever. August ’15 claims another bullish streak. Bottom line, some of the better trends ever have taken place without any 3% dips. Is this the start of a larger and deeper market correction?
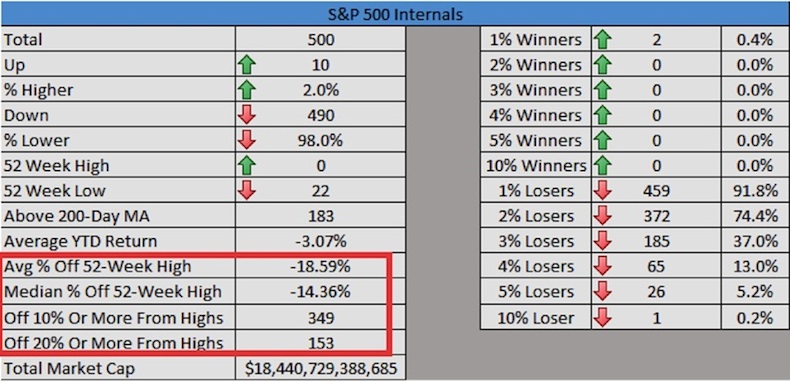
The big worry has been the deterioration under the surface. I’ve been noting many times how the ‘average stock’ in the S&P 500 was down more than 10% with the major index just a percent or two away from new highs. Clearly, the camel’s back finally broke late last week. And the S&P 500 is finally confirming the market correction that the Dow Jones Industrial Average, Nasdaq, and Russell 2000 hit last week. Lastly, as you can see below, the average stock in the S&P 500 is now 18.59% off its 52-week high. Also (as of Friday), 349 stocks are in a 10 percent correction. That’s a lot of weakness.
These are my proprietary internal stats from Friday.
Putting it all into perspective, the recent weakness (and now market correction) after a more than a 200% rally isn’t too shocking. I didn’t expect a 5 to 10 percent dip in a few days, but it’s what we do now that matters more. What is concerning is how quickly things fell apart. One plus, is sentiment is extremely one-sided. Many vocal bears are claiming victory. These are the same bears who have been crying wolf for years now. The bottom line is bad things ‘can’ happen when the S&P 500 is beneath its 200-day moving average.
Keeping it simple, being more defensive here is prudent, but I continue to think given the off-the-charts fear we are seeing, this too will be looked at as another buying opportunity when we look back six months from now.
Thanks for reading and good luck out there!
Twitter: @RyanDetrick
Any opinions expressed herein are solely those of the author, and do not in any way represent the views or opinions of any other person or entity.


: Showing Some Signs of Emerging Strength")
