At Global Technical Analysis, our investable universe of futures contracts includes 28 individual markets across 7 asset classes.
They can be categorized as follows: Agriculture: ZC, ZS, ZW, HE, LE Energy: CL, NG Equity Index: YM, ES, NQ, TF Foreign Exchange: 6A, 6E, 6B, 6C, 6N, 6S, 6J Interest Rates: FV, TY, US Metals: HG, YG, YI and Softs: CC, KC, OJ, SB.
As portfolio managers, we have various methods of attempting to explain the return profile of these individual markets. We also have the responsibility of building a portfolio consisting of some combination of these markets, or including all of them. Principal component analysis (PCA) makes this task more manageable.
When starting to look for relationships in the return data, the first thing we notice is the overwhelming number of data points. A simple correlation matrix has 784 data points. Additionally, each individual market is affected by numerous fundamental and technical factors.

Principal Component Analysis (PCA) allows us to reduce this large number of correlated variables into much fewer synthetic variables. These synthetic variables, which effectively replicate the original data, are referred to as principal components. The effectiveness of the principal components is measured by calculating the extent of the variance in the original data that they capture.
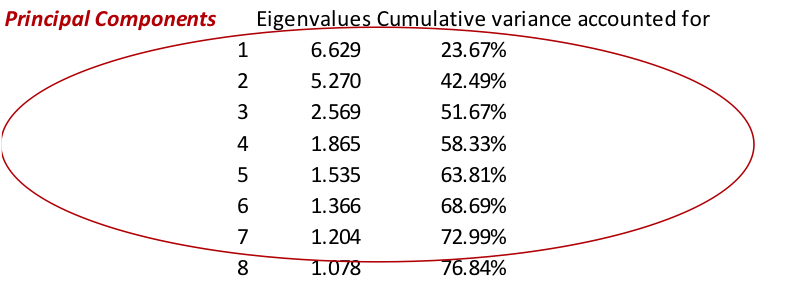
For our investable universe, 73% of the variance in portfolio returns is explained by 7 principal components. Although we do not definitively know what those components are, we believe they represent factors delineated by the 7 asset classes.
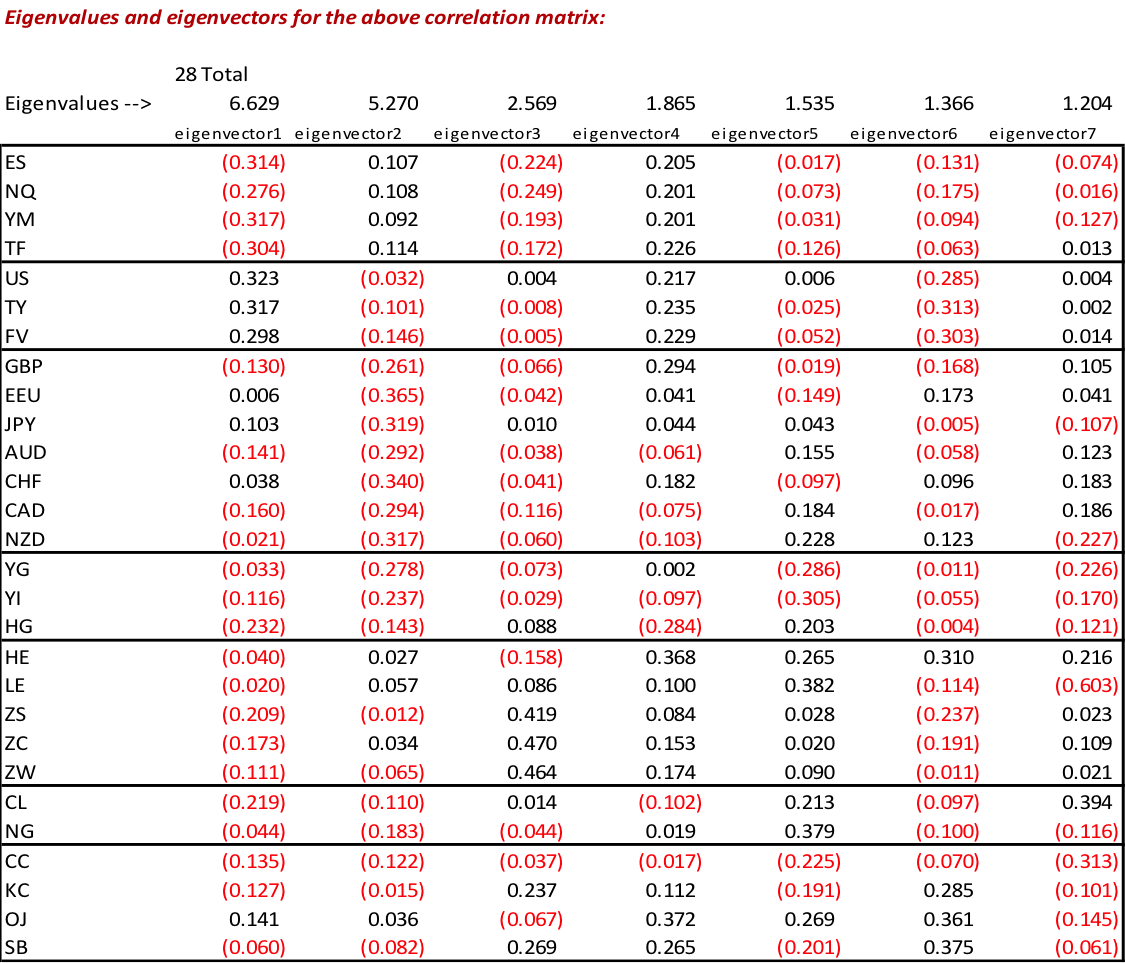
As for choosing which individual markets, within the 7 asset classes, to include in our portfolio we analyze the weightings of each market across the 7 principal components. Considering the average weightings across principal components, along with liquidity constraints, our portfolio composition currently consists of: ES: E-Mini S&P 500, FV: Five-Year Treasury Notes, 6E: Euro, HG: High-Grade Copper, ZC: Corn, CL: Crude Oil, and KC: Coffee.
We periodically run Principal Component Analysis to determine if and how the relationships within our investable universe are changing. Based upon this analysis, our portfolio composition may change also.
Thanks for reading.
Twitter: @Techs_Global
Any opinions expressed herein are solely those of the author, and do not in any way represent the views or opinions of any other person or entity.


 and Semiconductors (SMH): Concerning Price Pattern?")
 and Semiconductors (SMH): Concerning Price Pattern?")


