September of the 2nd year of the stock market “Presidential Cycle” is historically the weakest month of the 4-year cycle.
Since working off its early year correction, the U.S. stock market has been on one of those inexorable runs that we’ve seen on so many occasions in recent years. Such runs have seen the market essentially steamroll any and all potential pitfalls that may arise.
This recent run has been no exception as the stock rally has basically remained bulletproof to any exogenous hazards (real or fake).
But just when the market is on this roll, even breaking out to new highs and apparently incapable of going down, a bout of selling strikes, seemingly out of nowhere. However, if we look a little deeper, perhaps we shouldn’t be surprised by the recent weakness.
The stock market Presidential Cycle refers to the pattern of behavior in stock prices throughout the four years of a presidential term.
Specifically, stocks tend to be strong during certain periods of a president’s term and weaker during others. And while there are many factors influencing stock prices during a particular period of a particular presidential term, the cycle has been one of the more historically consistent seasonal patterns.
This may be relevant to the current weakness because, on average, the worst performing month of the cycle, historically, has been September of year 2, i.e., the current month.
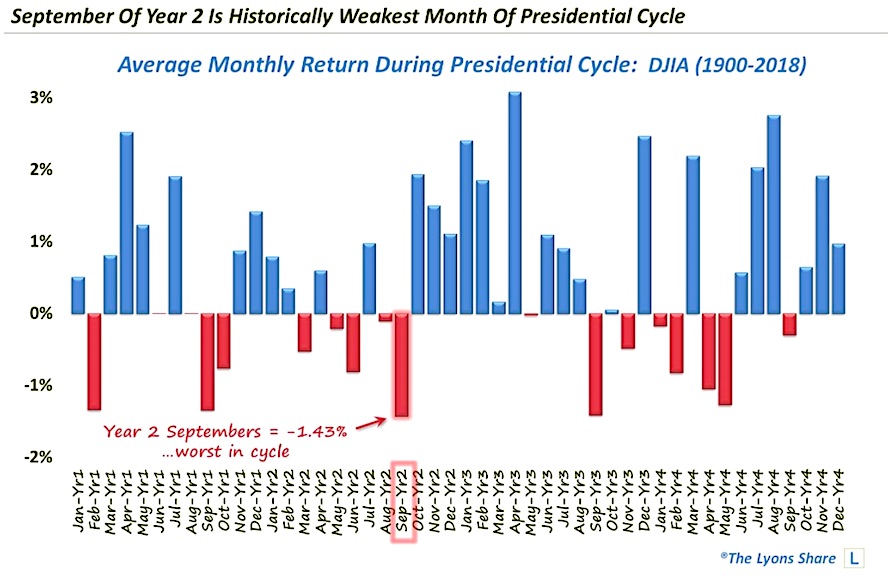
As the chart shows, since 1900, September of year 2 of the Presidential cycle has returned an average of -1.43%, slightly worse than September of year 3, February and September of year 1 and May of year 4.
Again, there are many factors that determine the market’s return in a particular month. And returns for a particular month in a particular year will not always match its historical average. That’s what makes an “average”. But to the extent that any month of the cycle can be relied upon to be weak, it is this September of the 2nd year of the Presidential cycle.
But just how reliable is it? And does the market’s recent level of conformity to the historical cycle enhance the pattern’s reliability? And to the extent that it does, what does it imply about the market’s potential path going forward?
In a Premium post at The Lyons Share, we discuss the current year’s performance relative to the historical pattern – and what it may portend following the current weakness.
If you’re interested in the “all-access” version of our charts and research, please check out our web site.
Twitter: @JLyonsFundMgmt
The author may have a position in mentioned securities at the time of publication. Any opinions expressed herein are solely those of the author, and do not in any way represent the views or opinions of any other person or entity.

: Showing Some Signs of Emerging Strength")

