A hawkish FOMC statement is driving the US Dollar higher while stocks saw a quick reversal downward. As well, precious metals (gold and silver) turned lower.
At the same time, this means that the market can stay in risk-off mode and more US Dollar gains can be seen… especially now as precious metals turn south.
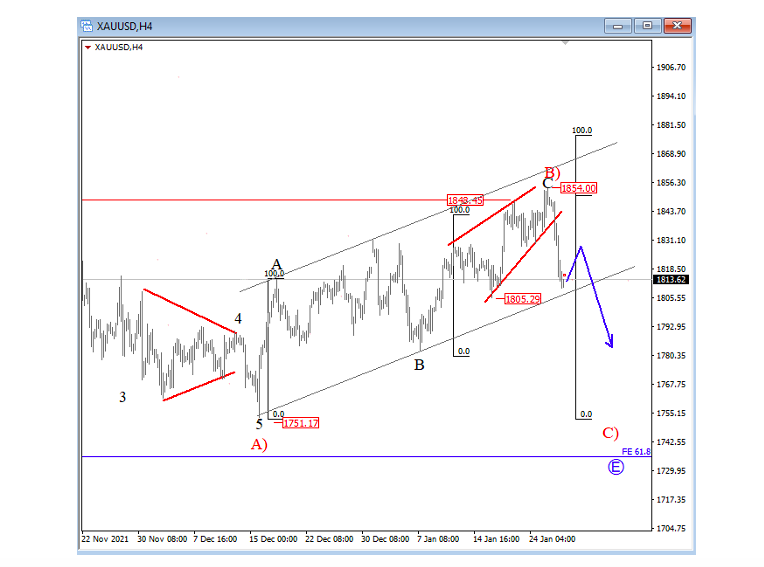
Gold is making a nice and sharp reversal from 1850 area as expected, where we see a completed ending diagonal after recent sharp reversal down. We see a minor impulse that may cause a break below the trendline support that can put much more weakness in play for wave C) of E, back to 1750 for final stages of a higher degree triangle pattern on a daily chart.
GOLD 4-hour Elliott Wave Analysis
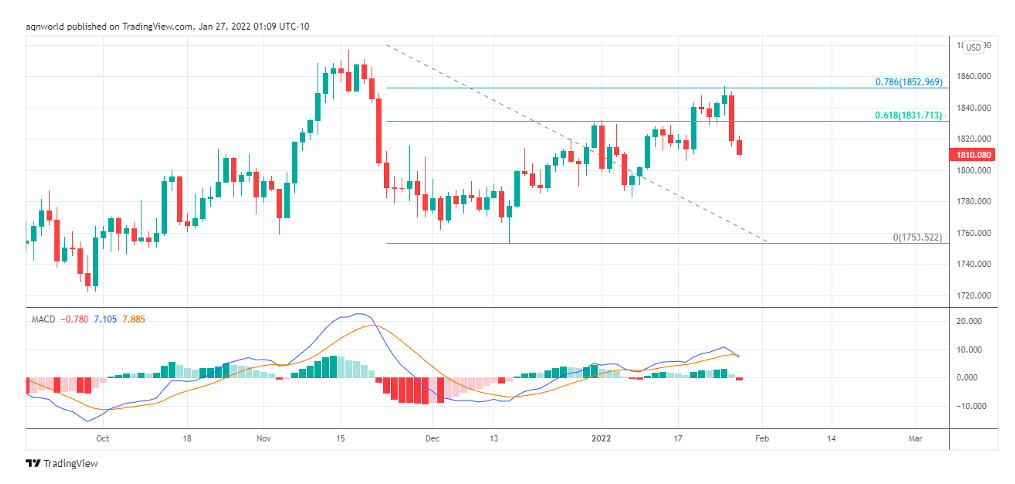
Technically GOLD tests 0.786 Fibonacci retracement level of November 2021 highs to December 2021 lows with spinning top Candlestick pattern at the top and slides from there, at the same time daily MACD generates sell signal means we may see more weakness ahead.
GOLD Daily Technical Analysis
XAGUSD
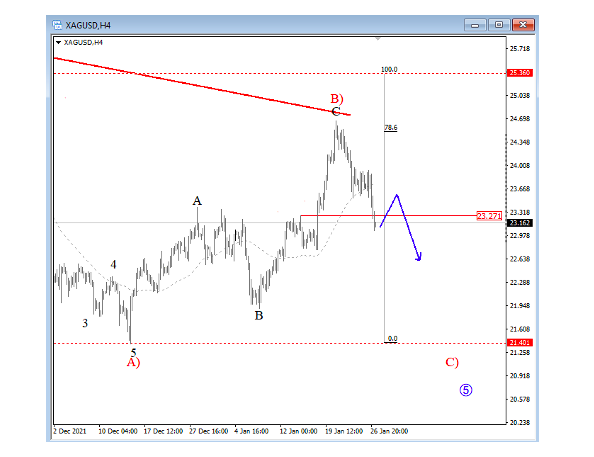
Silver has also been recovering since December but notice that recovery is made by three legs which is a corrective structure. In fact, the price fell back below 23.27 where overlap invalidated any impulsive/bullish interpretations, so we are bearish and are looking for further weakness into wave C) of five; the final leg of a higher degree ending diagonal that can boom near 20/21 sometime this year.
Silver 4-hour Elliott Wave Analysis
Twitter: @GregaHorvatFX
The author may have a position in the mentioned securities at the time of publication. Any opinions expressed herein are solely those of the author, and do not in any way represent the views or opinions of any other person or entity.

: Worrisome to Broader Market?")

