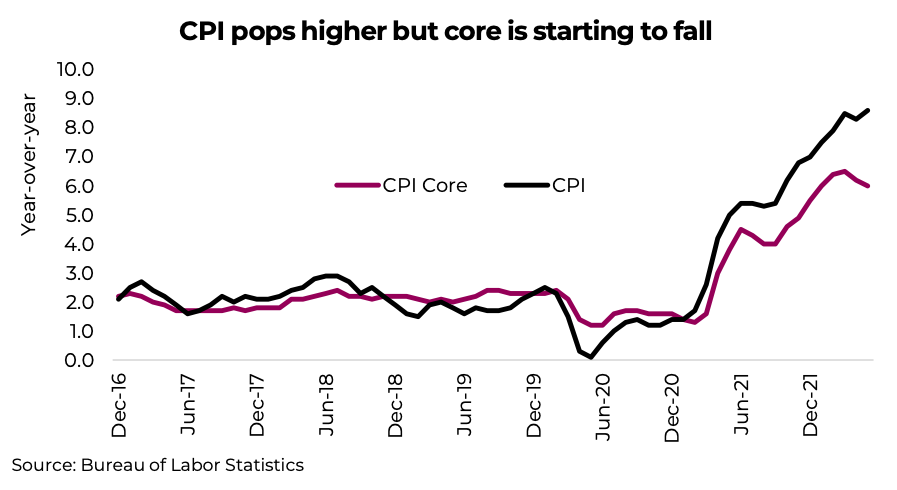
The biggest market-moving economic data, the U.S. Consumer Price Index (CPI), rose 1.0% in May, bringing the one-year tally to +8.6%.
One little silver lining: core CPI (which excludes food and energy) was 6.0% for the year, down from last month’s pace of 6.2% and marking the second month of declines.
But try as we may, it was hard to find good news with this data. This has clearly pushed equities lower as markets priced in even higher expectations of Fed Funds rate this year.

Global impact
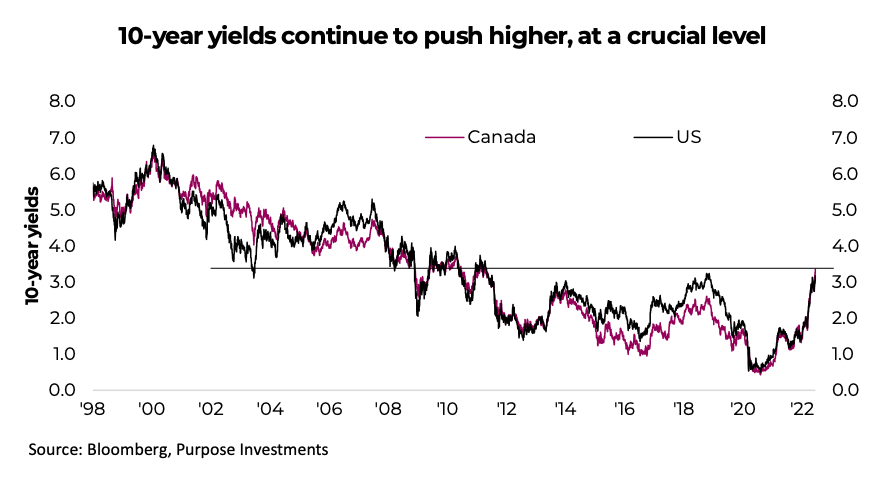
While CPI was an American economic release, the impact has been global. Bond yields moved higher in the U.S., Canada, Europe, and around the globe. The move Friday was about 10-15bps, which has the U.S. 10-year at 3.17% and the Canada 10-year up even higher at 3.35%. 10-year yields are now a decent amount over 3% and are at a critical technical level.

Fed rate hikes likely to continue
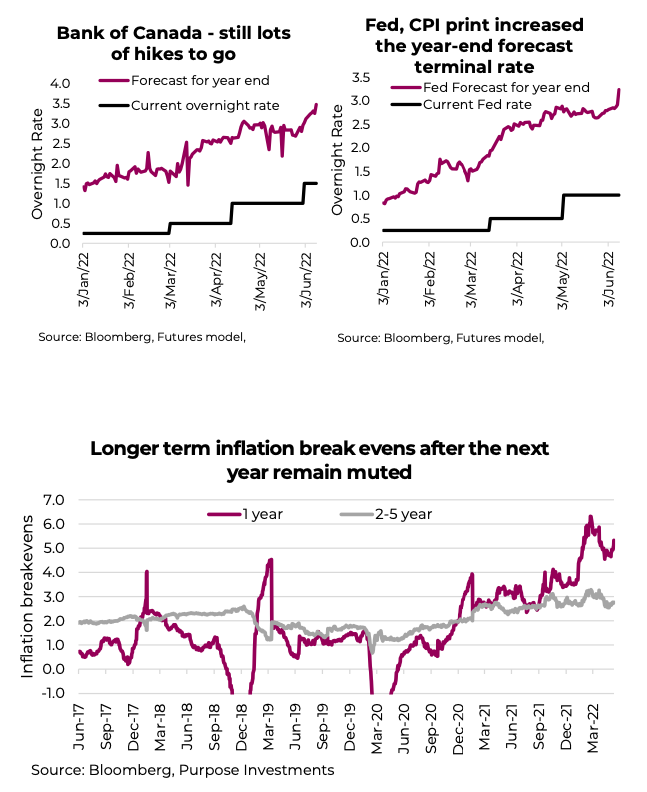
This data has certainly moved to reduce the doubt that the Federal Reserve Board would start moving in double steps. There are five Federal Open Market Committee meetings left in 2022, and futures markets are predicting a 3.24% Fed Funds rate by the end of the year, from the current 1%. That’s 44 bps of hiking per meeting. After yesterday’s Bank of Canada Financial System review, the rate hike paces are unlikely to let up anytime soon up north either. The futures market is now pricing in an overnight rate in Canada of 3.39%, compared with the current 1.5% level.

Some good news
There is a little encouraging news out there though. China Producer Prices continue to come down, which feeds into a lot of pricing further down supply chains. While inflation is clearly not going away just yet, break evens beyond the next 12 months point to cooling … at some point. Break evens represent the amount of inflation priced into the market during certain periods.
As you can see in the chart to the right, the one- 0.0 year implied inflation had been coming down but -1.0 spiked on the CPI print. But once again, the two-to five-year period remains muted.
Impact on Portfolios
At Richardson Wealth, we continue to believe the inflationary impulse will begin to fade later this year, but this is the first time we will have to admit that perhaps we are early on this call. The transition certainly won’t be smooth. The economy works in waves and some waves move faster than others. Higher financing costs and financial conditions are now starting to slow economic activity. The subsequent slowing of inflation is another wave that takes even longer, but we do believe it is still coming.
Given most portfolios tend to be much shorter duration than the overall bond market, we continue to recommend taking advantage of the rising yields by adding some duration back into the portfolio in stages.
Source: Charts are sourced to Bloomberg L.P., Purpose Investments Inc., and Richardson Wealth unless otherwise noted.
Twitter: @ConnectedWealth
Any opinions expressed herein are solely those of the authors, and do not in any way represent the views or opinions of any other person or entity.


