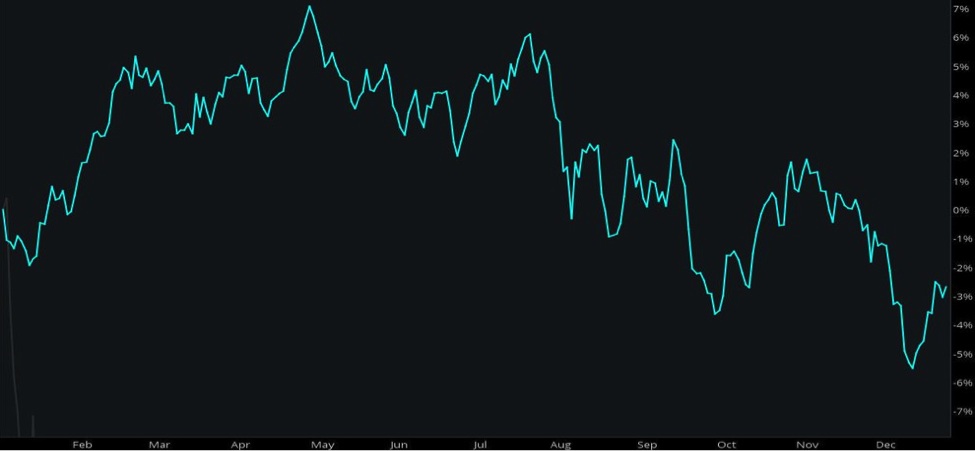
Looking at seasonality, XLE’s strongest cycle for the year has been late January through early May.
In closing, this is a great example of the trade structures that options can provide to be able to define risk and allowing for optimal reward. The institutional trader has a strong fundamental case for buying XLE at $45, but if it never gets down to that level, can profit immensely from the spread widening between the calls and puts. The trade also has some positive seasonality factors behind it.
In no way am I bullish on Energy at the current time, but seeing a trade like this gives me a good idea of where the smart money sees value in Energy, and is an early sign of a turn in sentiment, though as I have noted on Twitter many times, most of the individual energy names have been seeing massive put buying for the past 18 months, and I continue to see many of these positions roll out and down in strikes (HES, CLR, PXD, CXO, OAS, DVN, CHK, RIG, COP, EOG, MRO, NFX, SU, CNQ). We are likely to see a few credit events in the sector and names that simply cannot survive in this environment, but looking at the XLE heavily weighted positions, these are most of the strongest names that will survive. One could even structure a trade of being long XOM/CVX/OXY while being short the more troubled names.
Charts provided by ThinkorSwim and TradingView; seasonality chart provided by @Wolfmetric.
Twitter: @OptionsHawk
The author may hold a position in the related security at the time of publication. Any opinions expressed herein are solely those of the author, and do not in any way represent the views or opinions of any other person or entity.


: Showing Some Signs of Emerging Strength")
