When I interview people I love to ask them what their ‘One Chart’ is and why. This means that I want to know what is the one chart they use, other than the S&P 500, to get a good read on the overall current market environment and where things are headed.
Today I’m going to share with you my One Chart, which is the TLT, the Long Bond ETF.
Note that you can watch my in-depth video on “One Chart” on my YouTube channel.
20+ Year US Treasury Bonds ETF (TLT)
Essentially with the TLT, we have had the situation of a nice run-up over the summer months and then in September through December of last year (2019), you had a descending triangle pattern.
This was a pattern of lower highs combined with a pretty stable support level.
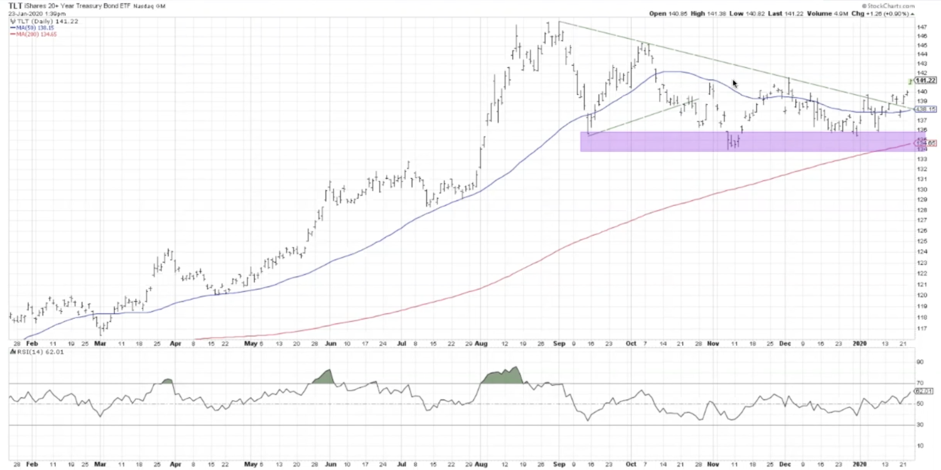
What that means is that you had a nice consolidation phase and you had a nice run-up sort of digesting those gains. As time goes on you have lower and lower highs, but stable support levels. Buyers are coming in supporting the price of a certain point and on the TLT it is in the 134-136 range consistently for a four-month period.
What has happened year-to-date has been a complete change. Instead of being in a consolidation period, we have now broken back up above the 50-day moving average, the TLT has now broken above trend-line resistance, it has now broken out of that descending triangle pattern and now resolved to the upside. So overall, this means it is showing more demand than supply and suggesting further upside as the TLT moves higher.
It is interesting to see where the TLT has been relative to resistance levels and most recently it broke above its swing-high from the beginning of January. It topped out just below 140, pulled back and tested support, but now it has broken above that. Now you have a pattern of higher-highs and higher-lows. This, by definition, is a new up-trend.
Now we’re testing its previous resistance, which is around 140-150, relatively. This came from the beginning of December and if it’s able to eclipse that resistance level I think it suggests a much further upside. If the TLT gets back up these levels from last August/ September/ October timeframe, that would coincide with a 1.5% yield on the tenure, obviously much lower and back towards the lows of the beginning of last fall. It would be a very different environment than what we’ve seen with interest rates over the last couple of months.
If you combine that chart of the TLT with the dramatic selloff in commodities and I think you’ll see a real rotation in asset allocation into bonds and into more defensive areas of the market. This could suggest possibly a potential weakness leading up here for stocks.
In terms of what I think about the TLT besides those key levels, I would also be looking at the RSI. As you can see, the RSI has been pretty range-bound, between 35-40 and between 65-60 on the upside. If we are able to get above that RSI 60 level and remain above there, it suggests enough demand to keep that momentum positive and keep pushing prices higher and yields lower.
You’ll note that on the most recent pullbacks, as the TLT has tested support, the RSI has never really gotten meaningfully below 40. This is characteristically more of a bullish environment. So again, if the RSI is able to rotate and remain in that bullish phase it confirms the breakout that we have seen in price.
Twitter: @DKellerCMT
The author does not have a position in mentioned securities at the time of publication. Any opinions expressed herein are solely those of the author, and do not in any way represent the views or opinions of any other person or entity.


