Oil stocks are at a seemingly “must-hold” level within their long-term reversal attempt.
If there is one sector that best symbolizes the prospects of the post-February stock market rally, it is energy. It isn’t that energy stocks have been the only area performing well in this rally. To the contrary, we have pointed out on numerous occasions the evidence of strong breadth within the rally.
As such, many segments of the market have been working, from longer-term relative strength leaders that continue to score new all-time highs to those beaten up sectors exhibiting momentous mean-reversion bounces. Oil stocks would fall into that latter category, of course. The question now is, will the bounce in oil stocks only be a mean-reverting move – or the start of a longer-term, more meaningful rally? One key index may be undergoing a test right now that could go a long way toward answering that question.
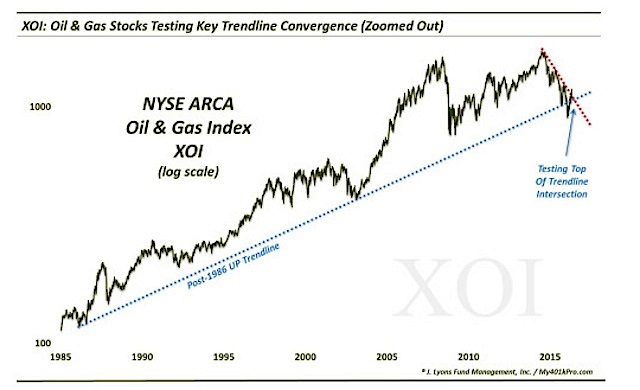
The index is the NYSE Oil & Gas Index, or XOI. We have mentioned the XOI several times in recent months as oil stocks have indeed been in the spotlight. Our main focus in those posts, including this April 13 piece most recently, has been on the lifetime (post-1986) Up trendline in the XOI, and its significance in delineating bullish prospects from bearish ones among oil stocks. This trendline is our “line in the sand”, as we called it, in determining the well-being of the XOI. And after dropping below the trendline in January for the first time in 30 years, the index was able to reclaim the line as we mentioned in the April post.
In the past 2 weeks, oil stocks have been hit hard, though. And over the last 24 hours, the index has dropped down to again test the top of that post-1986 up trendline. As the following charts show, also converging in the same vicinity is the down trendline from the XOI highs in 2014, which the index broke above a month ago. This could be a key test of the durability of the rally in oil stocks.
Long-Term:
Zoom In:
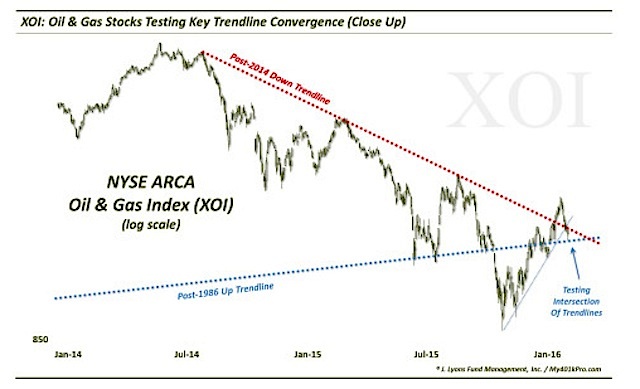
If the XOI is able to successfully hold this level (around 1070-1090), then the long-term turnaround potential in oil stocks can remain on track. If the XOI fails to hold here, in our view, oil stocks become vulnerable once again to significant downside.
Thanks for reading.
More from Dana: Why The Volatility Index May Be Ready To Rally
Twitter: @JLyonsFundMgmt
Read more from Dana’s Tumblr Blog
Author does not have a position in mentioned securities at the time of publication. Any opinions expressed herein are solely those of the author, and do not in any way represent the views or opinions of any other person or entity.


: Showing Some Signs of Emerging Strength")
