The energy sector has been an unpopular investment sector for some time. But the energy sector has been basing for a while now and select industries (ETFs and stocks) are providing opportunities right now.
The SPDR Oil & Gas Exploration & Production ETF (XOP) is one of my top longer-term ideas here.
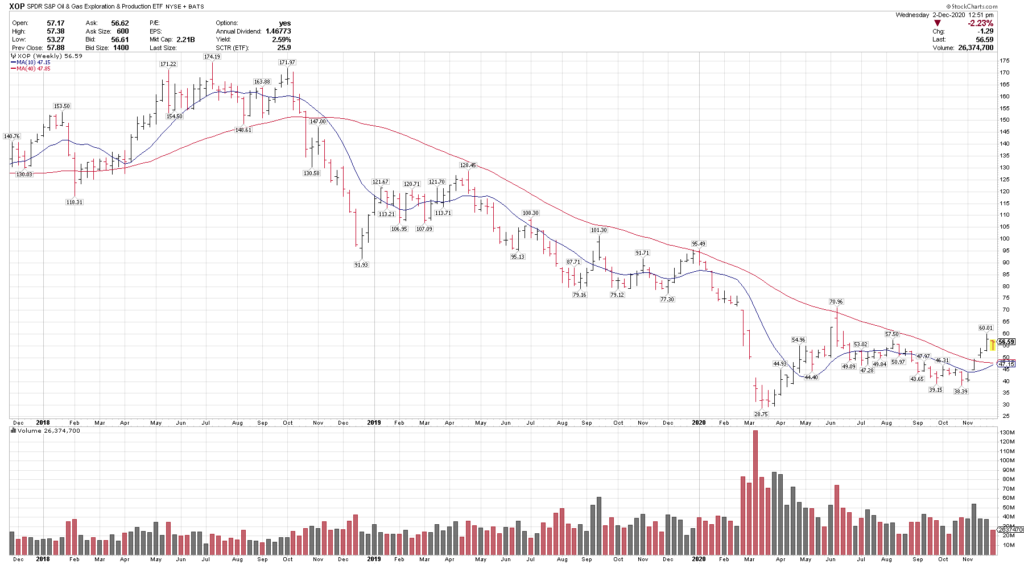
XOP recently reclaimed it’s 40-week moving average, after spending 25 months below, a key long-term trend signal. XOP also broke out to a 5-month high recently and tested the key $60 level.
Coming off of a recent 10 percent pullback, I believe that the Oil & Gas ETF (XOP) is setting up for another leg higher. The 20, 50 and 100-day moving averages have all turned up and the 200-day moving average is starting to flatten out.
Sector rotation can be sharp, and pullbacks can happen at any time, but as long as XOP stays over $50, I believe it offers very high potential reward vs risk here.
DISCLOSURE: I am currently long XOP and it went onto my Blue Chip Daily Buy List on November 17.
Larry is the publisher of the Blue Chip Daily Trend Report.
Twitter: @LMT978
The author has a position in $XOP at the time of publication. Any opinions expressed herein are solely those of the author, and do not in any way represent the views or opinions of any other person or entity.


