The October jobs report surprised nearly everyone, coming in at a very impressive 271,000 jobs created last month. Considering it was also the best month for the S&P 500 in four years, October 2015 was quite the month.
Here are some current and historical stats for you.
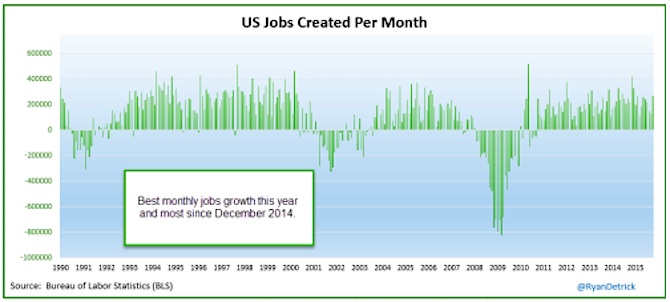
The October jobs report posted the best monthly jobs gain of the year and the most since December 2014. Also, jobs have been positive a record 61 straight months.
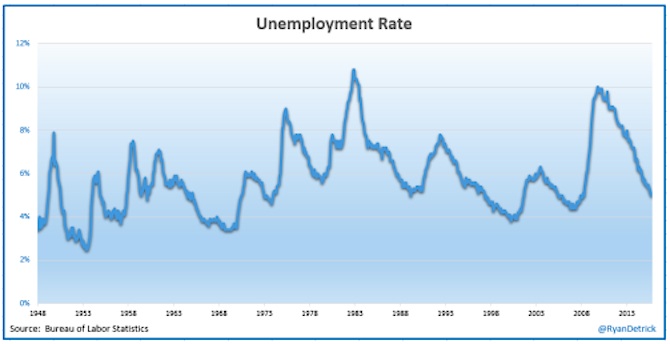
The unemployment rate was 5.0%, the lowest since 2008.
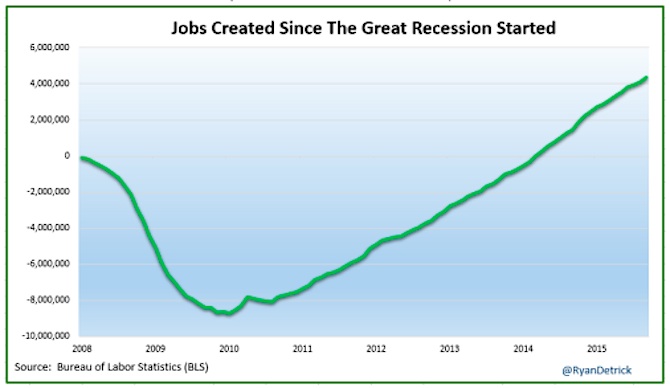
Since the Great Recession started in February 2008, more than 4.3 million jobs have been created. At the depths of the crisis, nearly nine million had been lost.
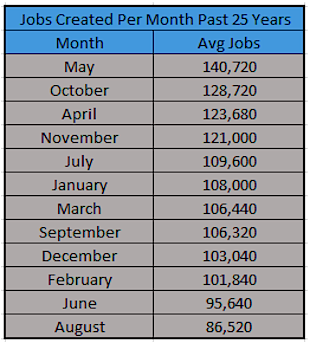
2015 has seen an average jobs gain of 206,200 per month. This is the second best year going back 16 years.
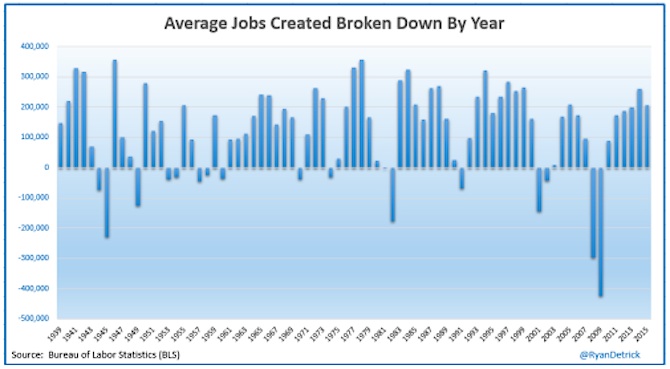
Going back 25 years, the October jobs report marks the second best month of jobs creation. In other words, today’s strength shouldn’t be a shock.
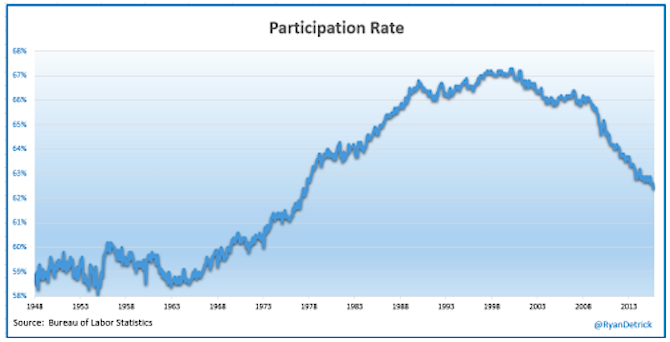
The participation rate was 62.4%, the lowest since the 1977. I’m not an economist, but many point to this as a major problem in the labor market. It could suggest many are simply giving up looking for a job.
Thanks for reading and have a great weekend.
Twitter: @RyanDetrick
Read more from Ryan on his tumblr.
Any opinions expressed herein are solely those of the author, and do not in any way represent the views or opinions of any other person or entity.
: Creating Bullish Divergence?")


 and Semiconductors (SMH): Concerning Price Pattern?")


