The UE rate is overstating the health of the US labor markets.
That is one explanation for why the Fed has lowered its unemployment target.
Quantity Over Quality
Another reason that wage growth remains muted is the abundance of part time jobs. During the crisis, part time employment rose while full time employment fell. Part time employment has been relatively flat since then:
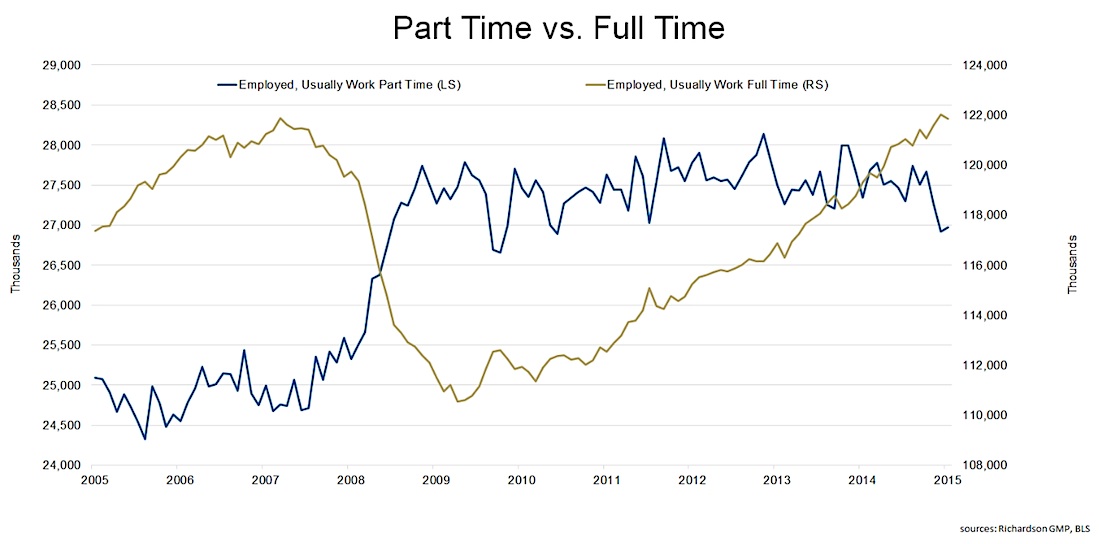
Full time employment is back to where it was before. That said, the high number of part time jobs may be putting downward pressure on wage inflation.
Along the same lines, many of the jobs that have been added are “cheap labor.” What that means is that they are not high paying jobs. The next graph shows the employment to population ratios by education level:
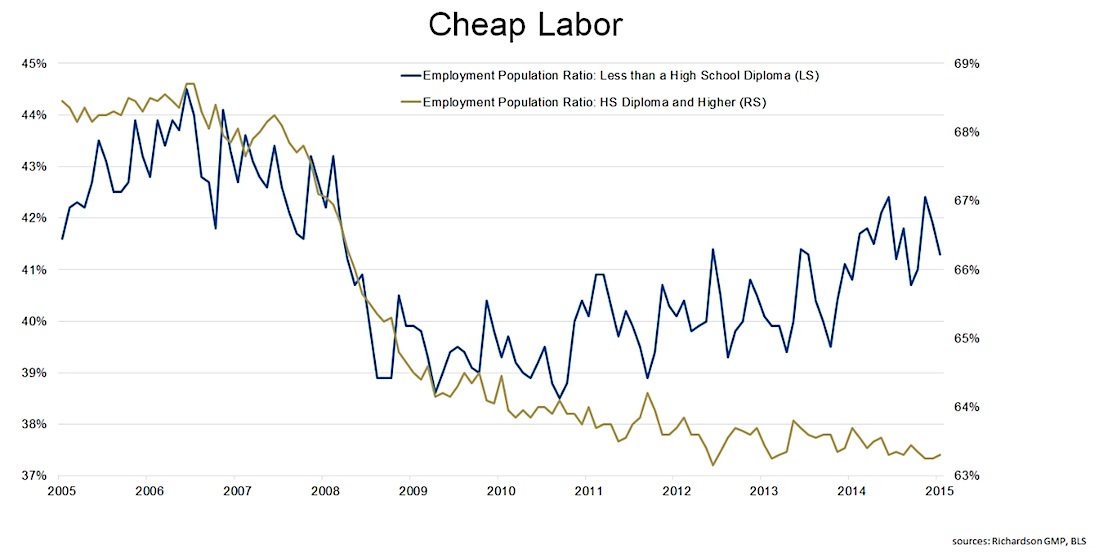
Contrary to what we may expect, the EP ratio for people with less than a high school diploma has been improving while the ratio for people with more than a high school diploma has been worsening. Therefore, it is logical to assume that many of the jobs that have been added are low quality ones.
To Hire or Not To Hire
In the US, there has been a lot of talk about job openings, which are at multi-year highs. Naturally, it makes sense to assume that more openings would imply a larger demand for labor. That, in turn, would lead to higher wages. The problem is that openings do not always get filled. As we will see in the following diagram, hires are lagging behind openings:
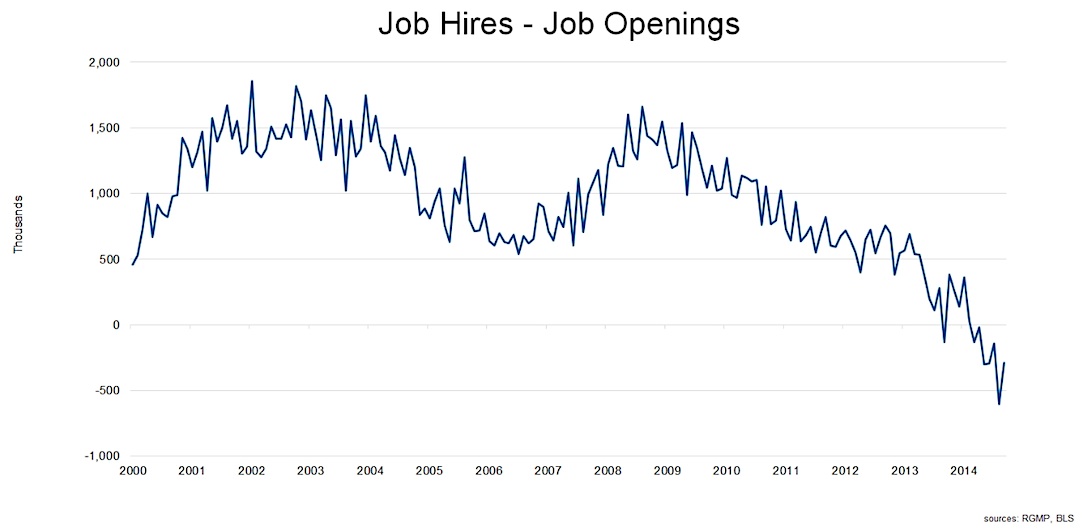
Said another way, the number of openings is rising faster than the number of hires is. Part of the cause for this trend is the mismatch between what employers want and what candidates have to offer. In addition, employers are being extra choosy “and are intensifying their hunt for the “purple squirrel” – candidates with the perfect combination of skills, education and experience…”
Wage Growth or a Lack Thereof
After the financial crisis, wage growth rebounded quickly and then peaked at 4.37% YoY in October of 2010. Wage inflation has been relatively steady since early 2011:
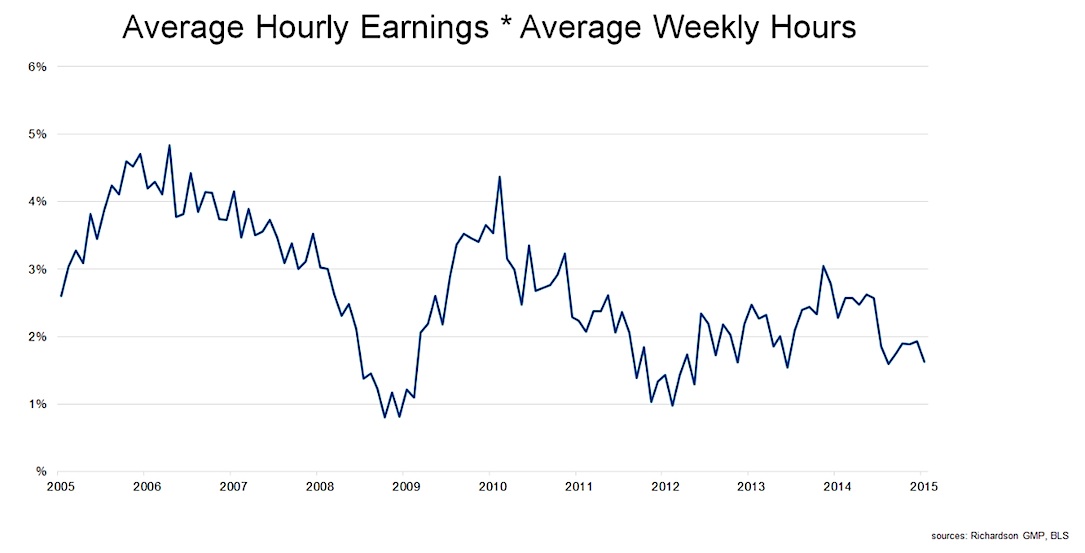
The upper bound is ~3% while the lower bound is ~1%. Currently, wage growth is the middle of that range; the last reading was 1.63%.
Not So Full Employment
Positive wage growth is a good thing. Still, it is not accelerating the way it would if we were at full employment. The US labor markets are not weak but they are not as strong as some of the headline data suggests they are.
If we look beneath the surface then it is clear that there are multiple explanations for the lack of growth in wage inflation. Many people are leaving the labor force, some of the jobs that have been added are low quality ones and openings are outpacing hires.
There is still slack in the labor markets. Maybe that is why the Fed has not moved yet.
If our analysis is right then what are the implications? Rates will stay lower for longer.
Thanks for reading.
Twitter: @sobata416
Any opinions expressed herein are solely those of the author, and do not in any way represent the views or opinions of any other person or entity.

: Worrisome to Broader Market?")
