Many savvy investors look at the NYSE Composite to gauge the health of the broader market.
With the markets in correction mode, we will look at this broad based stock index for clues about the stock market correction.
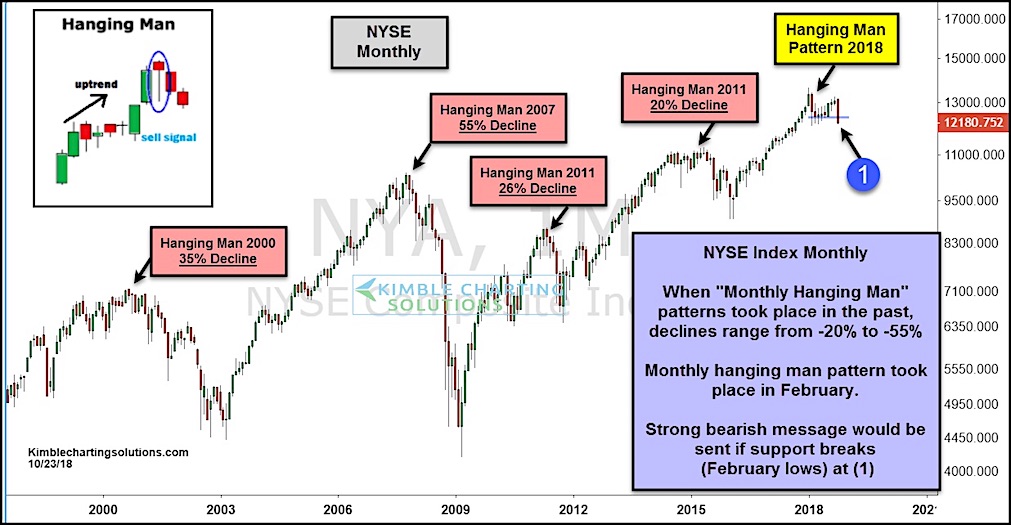
In the chart below, you can see that the NYSE Composite has foretold stock market correction with “hanging man” monthly candlesticks.
This occurs when the market falls sharply intra-month and rallies into the market close (yet still closing the month below where it opened). This pattern exerts a lot of energy and still produces a red candle… with a long tail “wick”.
This occurred in 2000, 2007, 2011, 2015, and once again in 2018.
The key here is that the NYSE holds on to the 2018 lows (or regains them quickly upon loss). Right now, we are trading below this year’s monthly “closing” lows and near the overall lows. Pay attention!
The broad NYSE Composite could be warning investors that the broader stock market is ready to head lower once more if support at (1) breaks and is not immediately recovered.
NYSE Composite Chart
Note that KimbleCharting is offering a 2 week Free trial to See It Market readers. Just send me an email to services@kimblechartingsolutions.com for details to get set up.
Twitter: @KimbleCharting
Any opinions expressed herein are solely those of the author, and do not in any way represent the views or opinions of any other person or entity.

 Testing Important Price Support")
: Cup (and Maybe Handle) Watch")

