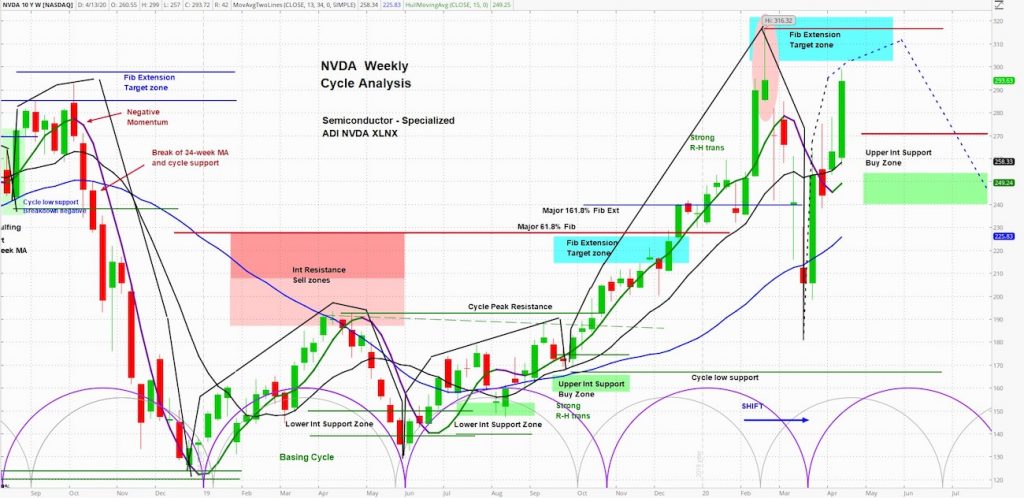
NVIDIA (NVDA) Weekly Chart
NVIDIA NASDAQ: NVDA announced they have secured China’s approval for its $6.9B buyout of Mellanox (MLNX).
NVDA rose almost 5% on the trading day Thursday.
Given this news, let’s see what the charts tell us.
At askSlim we use technical analysis to evaluate price charts of stocks, futures, and ETF’s. We use a combination of cycle, trend and momentum chart studies, on multiple timeframes, to present a “sum of the evidence” directional outlook in time and price.
askSlim Technical Briefing:
The weekly cycle analysis suggests that the stock is in a rising phase. The next projected intermediate-term low is due in the middle of August. Weekly momentum is positive.
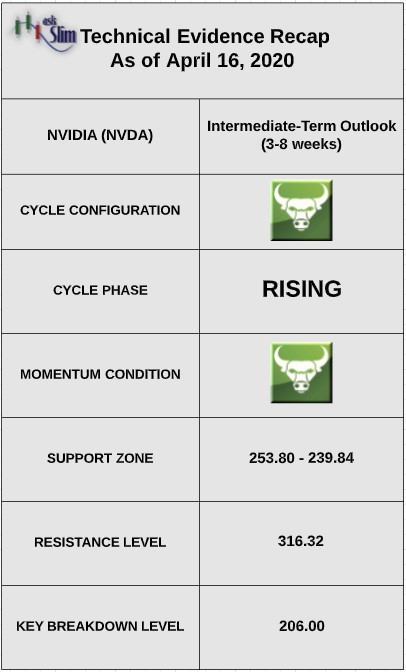
On the upside, the only visible resistance is the all-time-high at 316.32. On the downside, the stock has rising intermediate-term Fibonacci supports from 253.80 – 239.84. For the bears to regain control of the intermediate-term, we would likely need to see a close below 206.00.
askSlim Sum of the Evidence:
NVDA is in a rising phase with positive weekly momentum. The stock is approaching its prior all time high and is likely to encounter some resistance. There is a likelihood that the stock tests the intermediate-term supports beginning at 254 by June.
Interested in askSlim?
Get professional grade technical analysis, trader education and trade planning tools at askSlim.com. Write to matt@askslim.com and mention See It Market in your email for special askSlim membership trial offers!
Twitter: @askslim
Any opinions expressed herein are solely those of the author, and do not in any way represent the views or opinions of any other person or entity.

 Flirting With Critical Support… Again")


