This is just one of several headlines about stagflation we have seen this week:
April 27, 2023 TheStreet.com
Stagflation Risks In Focus As U.S. Economy Slows, But Inflation Stays High
“The coveted soft landing is looking increasingly difficult to achieve and we are now getting towards a position where the market may become concerned that stagflation could be a likely possibility. The next set of inflation statistics are going to be crucial for the subsequent moves by the Fed.”
Now that stagflation has gone mainstream, we thought it a good time to review
First-how ahead of the curve we were and
Secondly, if the trades we loved coming into a stagflationary environment are as exciting as they were when we were well ahead.
I dug up this Daily I wrote on February 26, 2020: PRE-COVID
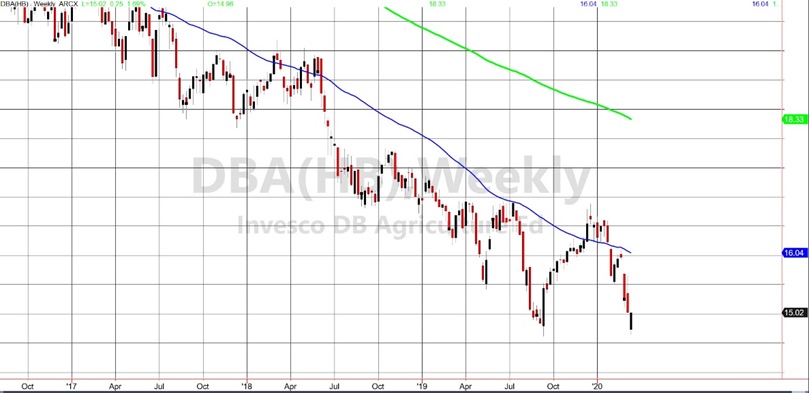
The chart of DBA (Agriculture Fund ETF) above, is from the same day.
“But what has held and could complete the “flation” part of the stagflation scenario? Soft and agricultural commodities.
Let’s take an example- DBA The 2019 low was 14.62. The 2020 low from yesterday is 14.65. That could be an auspicious double bottom.
It also could be the start of what we are already seeing from the human “psyche,” like the hoarding of toilet paper: The rising awareness that if food production and distribution begin to seriously falter, raw material prices will skyrocket.”
Now, typically with everyone talking “stagflation”, the trades we loved from 2020 until now have become less interesting.
Clearly, fresh news can emerge (Mother Nature, Social Unrest, Geopolitics, etc) and create a new spike in food and metal prices.
However, the economy might have contracted enough and will now just limp along for a year or so.
Plus, inflation might have peaked but will stay elevated in more of a sideways pattern.
If this turns out to be correct, the real nagging and difficult to navigate stagflation is here.
Truly that is the most difficult time to invest.
It is also when great stock pickers prevail.
Looking at the gold (GLD) chart from April 28, 2023, supports the not-as-interesting-now trade theory.
GLD is trading under the 50-DMA (blue) confirming a caution phase.
The island top from April 13th is intact.
Generally, that is a reliable signal of a top where we could see a 10% decline in price from there. That could take GLD down to around 172-175.
Real Motion, MarketGauge’s proprietary momentum indicator shows that GLD’s momentum has declined.
However, it is coming close to support at its 50-DMA and if holds, could mean the price clears back over the 50-DMA on the price chart.
So, we are not bearish or bullish right here. We are simply pointing out that we were incredibly bullish up until recently. Now, we need something fresh to happen to spike gold up above the island top.
A decent trade, but not, as we have been touting before, the best trade we see.
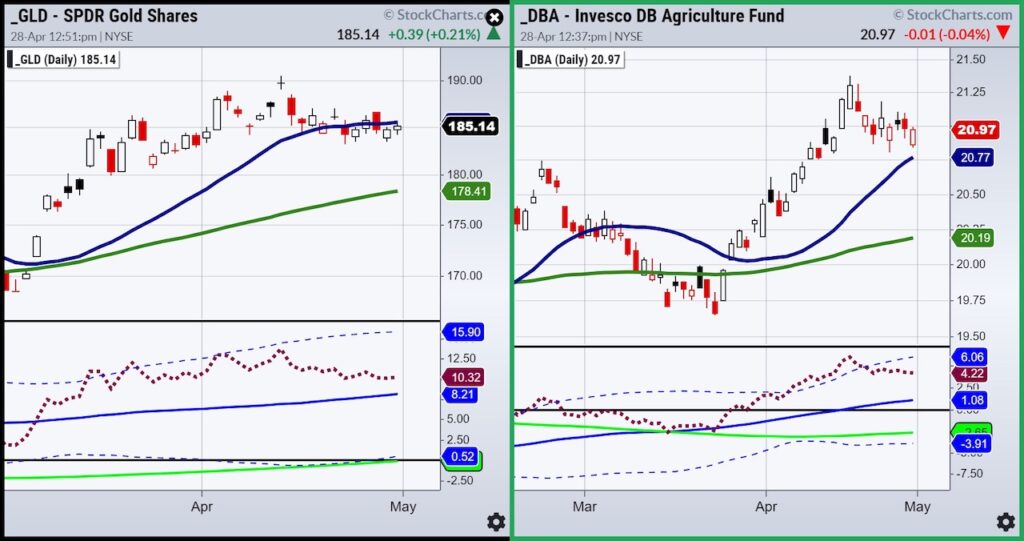
DBA is in better chart position.
DBA remains trading over its 50-DMA at 20.77. The phase is bullish, and the slope is positive.
Should DBA hold above the 50-DMA and take out the recent highs, then we can assume one of those potential fresh news events happened.
If not, the Real Motion indicator signaled a mean reversion on April 21st.
Momentum is declining so we need to see that change to a more upward momentum and back over the Bollinger Band (dotted).
Both GLD and DBA could turn out to be exciting, but right now, considering inflation might have peaked but will stay elevated in more of a sideways pattern, we are neutral both instruments.
As far as stock picking, please refer to all the articles written on the 23-month and 80-month moving averages on our website. Here is one Gaining an Edge in a Tough Trading Year.
Our discretionary trading strategy is now based on finding instruments using our Complete Trader Scans that fits one of these setups:
My prediction-SPY QQQs DIA continue to rally-until IWM cannot clear $200-then everything sells off again.
Stock Market ETFs Trading Analysis & Summary:
S&P 500 (SPY) 23-month MA 420
Russell 2000 (IWM) 170 support – 180 resistance
Dow (DIA) Over the 23-month MA-only index
Nasdaq (QQQ) 329 the 23-month MA
Regional banks (KRE) 43 now pivotal resistance
Semiconductors (SMH) 246 the 23-month MA
Transportation (IYT) 202-240 biggest range to watch
Biotechnology (IBB) 121-135 range to watch from monthly charts
Retail (XRT) 56-75 trading range to break one way or another
Twitter: @marketminute
The author may have a position in mentioned securities at the time of publication. Any opinions expressed herein are solely those of the author and do not represent the views or opinions of any other person or entity.


 Sending a Warning to Tech Stocks?")


