In today’s post, I’m sharing a monthly review and outlook that I do on select markets, indexes, stocks, commodities, currencies, etc…
This note includes my analysis from October (so you can see how that fared) for the S&P 500 and the 30 Year Treasury Bond Yield, along with my outlook for November for the S&P 500 and Apple (AAPL) – this went out to subscribers.
Here’s a couple quick hitter from our October 2018 review
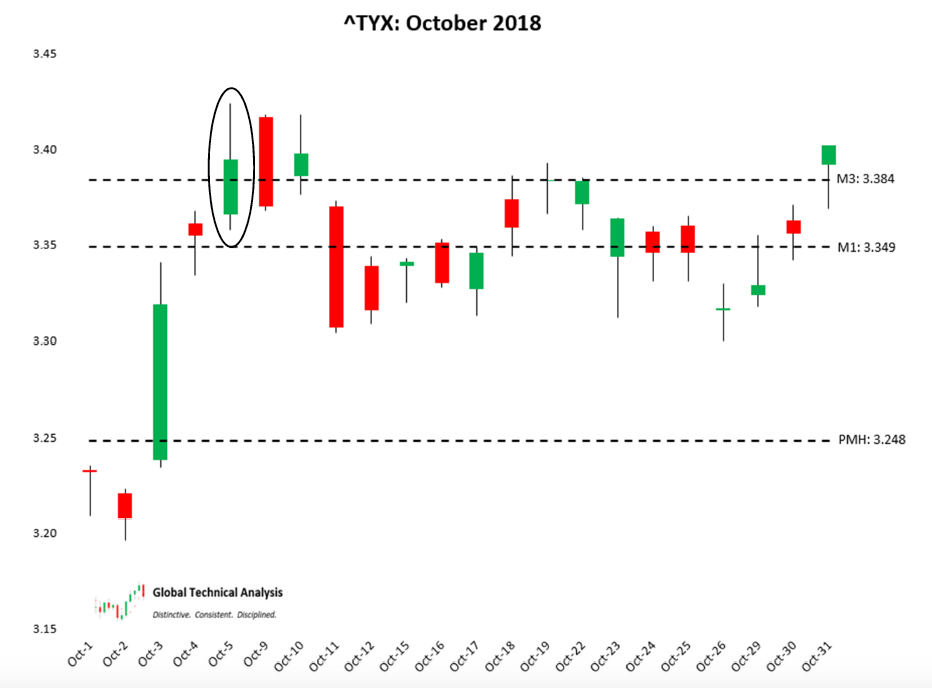
30-Year U.S. Treasury Bond Yield
We will begin with a review of the 30-Year U.S. Treasury Bond Yield (^TYX) during October 2018. In our October 2018 edition of The Cartography Corner, we wrote the following, with emphasis given to shaded excerpts:
In isolation, monthly support and resistance levels for October are:
- M4 3.5330
- M3 3.3840
- M1 3.3490
- PMH 3.2480
- Close 3.1970
- M2 3.1070
- MTrend 3.0804
- PML 3.0350
- M5 2.9230
Active traders can use 3.2480 as the upside pivot, whereby they maintain a long position above that level (long yields, short bonds). Active traders can use 3.0804 as the downside pivot, whereby they maintain a short position below it (short yields, long bonds).
Figure 1 below displays the daily price action for October 2018 in a candlestick chart, with support and resistance levels isolated by our methodology represented as dashed lines. October opened by spending the first two trading sessions attempting to push lower than September’s closing yield of 3.197. On the third trading session, the sell signal for active traders was given. With the yield rising as high as 9.30 basis points above September’s high yield of 3.248, October 3rd closed the session at 3.319.
The following four trading sessions were spent with the yield blowing through our second resistance level at M1: 3.349 to, and through, our third resistance level at M3: 3.384. The high yield for the month of October was achieved on October 5th at 3.424 (circled on the chart). The close on October 10th at 3.398 contained the price-action for the following fourteen trading sessions. Those sessions were spent with the yield rotating down to (and through) our isolated resistance level, now acting as support, at M1: 3.349 and up to resistance at M3: 3.384.
On the last trading session of October, the yield surpassed resistance at M3: 3.384, closing at the high yield for October at 3.402.
By following our analysis, active traders were able to realize a gain of (at least) 13.1 basis points. Within the first five trading sessions of October, active traders monetized (at least) 58% of the monthly range.
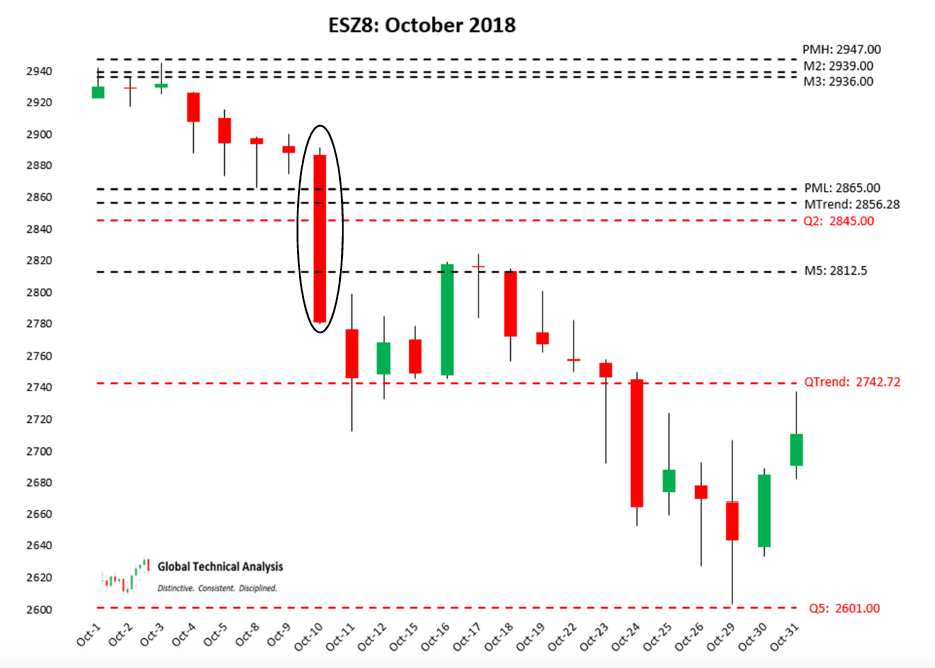
E-Mini S&P 500 Futures
We continue with a review of E-Mini S&P 500 Futures (ESZ8) during October 2018. In our October 2018 edition of The Cartography Corner, we wrote the following, with emphasis given to shaded excerpts:
In isolation, monthly support and resistance levels for October are:
- M4 3103.00
- M1 2976.50
- PMH 2947.00
- M2 2939.00
- M3 2936.00
- Close 2919.00
- PML 2865.00
- MTrend 2856.28
- M5 2812.50
Active traders can use 2947.00 as the upside pivot, whereby they maintain a long position above that level.
Active traders can use 2856.28 as the downside pivot, whereby they maintain a flat or short position below it.
Figure 2 below displays the daily price action for October 2018 in a candlestick chart, with support and resistance levels isolated by our methodology represented as dashed lines. October opened by spending the first three sessions hovering just under our clustered-resistance levels at M3: 2936.00 / M2: 2939.00 / PMH: 2947.00. That the market ascent failed at those levels helps to explain why we isolated the buy level for active traders at PMH: 2947.00. With 3 resistance levels in such close-proximity, above which existed a significant gap to higher levels, it was incumbent to make the price action prove itself.
The following four sessions were spent with the price descending to clustered-support levels at PML: 2865.00 / MTrend: 2856.28. On October 10th (circled on the chart), those support levels were breached and the sell signal for active traders was given.
For those market participants who were unprepared, what followed next was brutally painful. For followers of our work, October could not have been more accurately-profitable.
Our Monthly Downside Exhaustion level at M5: 2812.50 was achieved (and surpassed) on the same trading session our clustered-support levels were breached. However, multi-time-period analysis is a key feature of our analysis and it allowed us to stay with the trade. In addition to our monthly support and resistance levels, Figure 2 below includes three quarterly support levels represented as red-dashed lines.
On October 11th, the price descended to (and through, intra-day) Quarterly Trend and closed above it. As we stated in our Introduction and User’s Guide, Quarterly Trend is the most important level in our analysis. For the following four trading sessions, Quarterly Trend stopped the price descent in its tracks, with the price rotating up to (and slightly through) M5: 2812.50, now acting as resistance.
Over the following four trading sessions, the price made a renewed attack on Quarterly Trend. On October 23rd, the price closed at 2746.25, just above that crucial support level. During the next trading session, October 24th, Quarterly Trend was breached.
Over the following four trading sessions, the price descended to our Quarterly Downside Exhaustion level at Q5: 2601.00. The low price was achieved on October 29th at 2603.00.
The final two trading sessions were spent with the price ascending to QTrend: 2742.72, now acting as resistance.
The purpose of our methodology is to amplify, clarify, and punctuate support and resistance levels in the markets that we analyze. In the month of October, our analysis accurately identified 100% of the monthly range and the intra-month pivot points.
November 2018 Analysis
We begin by providing a monthly time-period analysis of E-Mini S&P 500 Futures (ESZ8). The same analysis can be completed for any time-period or in aggregate.
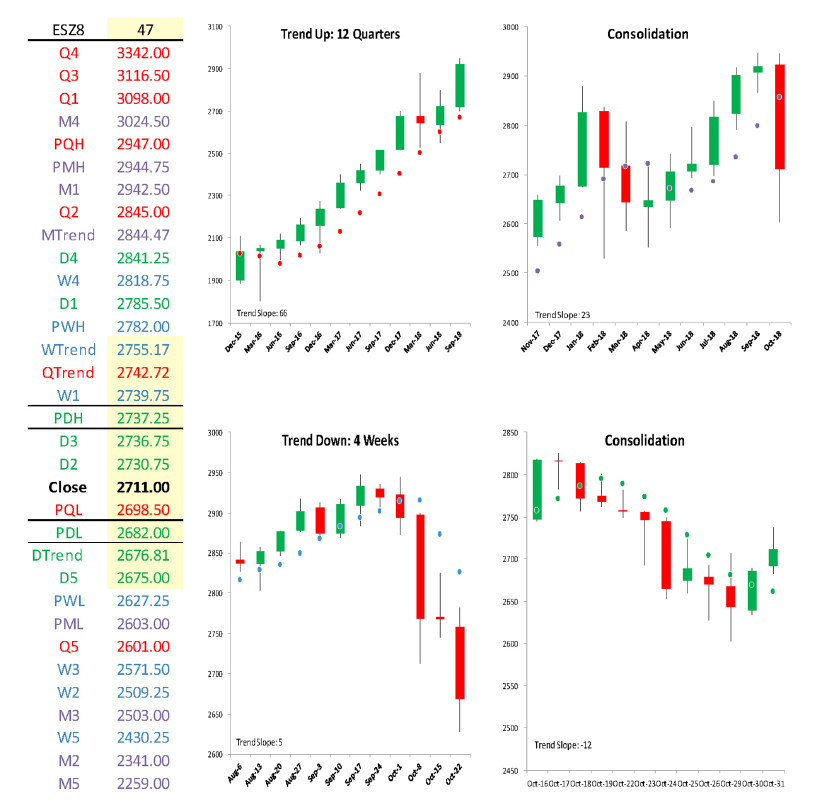
Trends:
- Monthly Trend 2844.47
- Weekly Trend 2755.17
- Quarterly Trend 2742.72
- Current Settle 2711.00
- Daily Trend 2676.81
As can be seen in the quarterly chart above, E-Mini S&P 500 Futures have been trading higher in price since the fourth quarter of 2015 and have been “Trend Up” for twelve straight quarters. However, the current market price is now below Quarterly Trend. Patience is required as there are still two months left until we can determine if the price closes below 2742.72 and breaks the running twelve-quarter trend.
Stepping down one level in time-period, the monthly chart shows that E-Mini S&P 500 Futures are in “Consolidation”, ending the most recent five-month uptrend. The futures contract settled the month of October significantly below Monthly Trend, erasing the previous four-months gains. Stepping down to the weekly timeperiod, the chart shows that E-Mini S&P Futures have been “Trend Down” for four weeks. Technical analysis of E-Mini S&P 500 Futures suggests that the market is aggressively trying to turn lower for a sustained downtrend.
As is typical, the shorter time periods signal a trend change first. Conviction is gained as the longer monthly and quarterly periods confirm the change.
Support/Resistance:
In isolation, monthly support and resistance levels for November are:
- M4 3024.50
- PMH 2944.75
- M1 2942.50
- MTrend 2844.47
- Close 2711.00
- PML 2603.00
- M3 2503.00
- M2 2341.00
- M5 2259.00
Active traders can use 2844.47 as the upside pivot, whereby they maintain a long position above that level.
Active traders can use 2603.00 as the downside pivot, whereby they maintain a flat or short position below it.
Given the large distance between monthly levels, unless October’s low is breached, we suggest using the weekly levels each week to guide us through the month of November.
APPLE INC. – $AAPL
For the month of November, we focus on Apple Inc. stock. We provide a monthly time-period analysis of Apple Inc. (AAPL). The same analysis can be completed for any time-period or in aggregate.
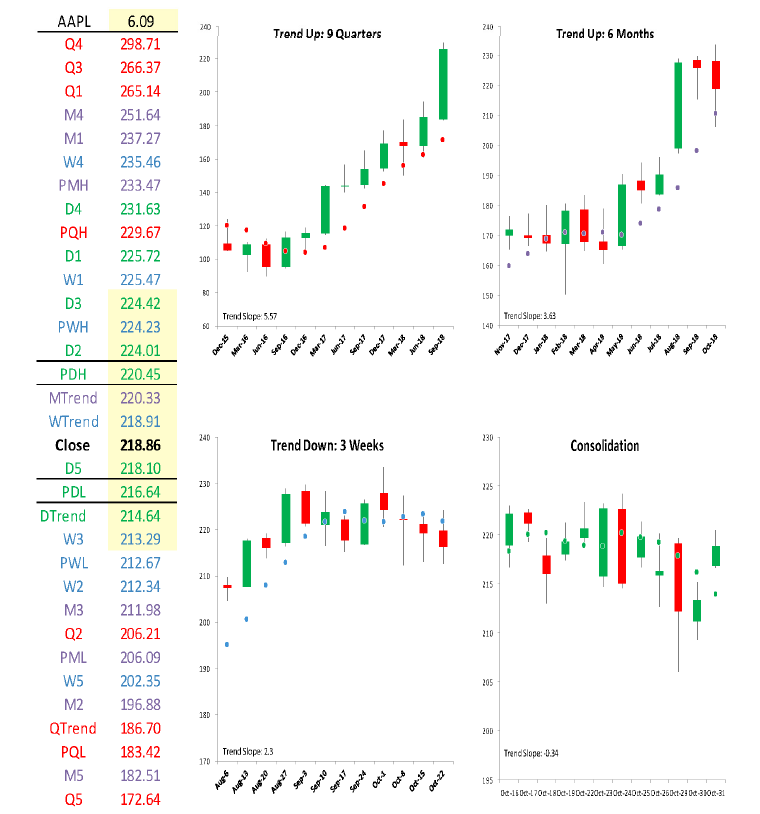
Trends:
- Monthly Trend 220.33
- Weekly Trend 218.91
- Current Settle 218.86
- Daily Trend 214.64
- Quarterly Trend 186.70
As can be seen in the quarterly chart above, Apple Inc. has been trading higher since the third quarter of 2016 and has been “Trend Up” for nine quarters. Stepping down one level in time-period, the monthly chart shows that Apple Inc. has been “Trend Up” for six months. Stepping down to the weekly time-period, the chart shows that the Apple Inc. has been “Trend Down” for three weeks. Technical analysis of Apple Inc. suggests to us that perhaps the intermediate trend is in the early stage of a reversal to lower prices.
Support/Resistance:
In isolation, monthly support and resistance levels for November are:
- M4 251.64
- M1 237.27
- PMH 233.47
- MTrend 220.33
- Close 218.86
- M3 211.98
- PML 206.09
- M2 196.88
- M5 182.51
Active traders can use 220.33 as the upside pivot, whereby they maintain a long position above that level.
Active traders can use 211.98 as the downside pivot, whereby they maintain a short or flat position below it.
Summary
The power of technical analysis is in its ability to reduce multi-dimensional markets into a filtered two-dimensional space of price and time. Our methodology applies a consistent framework that identifies key measures of trend, distinct levels of support and resistance, and identification of potential trading ranges.
Our methodology can be applied to any security or index, across markets, for which we can attain a reliable price history. We look forward to bringing you our unique brand of technical analysis and insight to many different markets. If you are a professional market participant, and are open to discovering more, please connect with us. We are not asking for a subscription, we are asking you to listen.
Thanks for reading.
Twitter: @Techs_Global
The author may have a position in the mentioned securities at the time of publication. Any opinions expressed herein are solely those of the author, and do not in any way represent the views or opinions of any other person or entity.


: Showing Some Signs of Emerging Strength")
