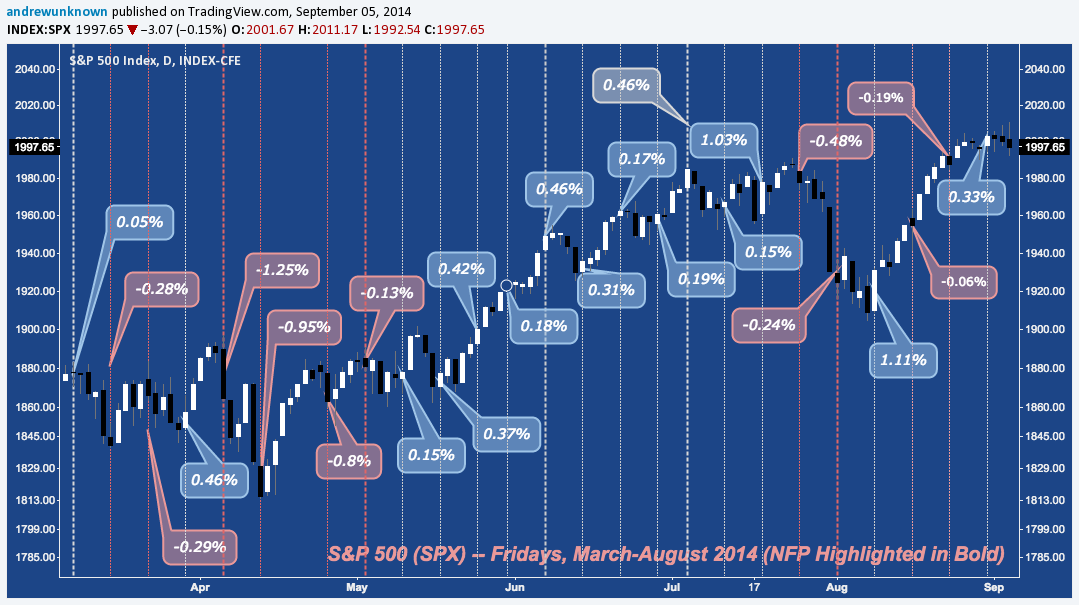
Just Ahead of Today’s NFP release at 0830ET, here’s a brief look at how Fridays featuring “the jobs report” have fared over the last 6 months (March-August):
All Fridays: 25
- Average overall: 0.05%
- 15 positive (60%) — Average positive: 0.36%
- 10 negative (40%) — Average negative: -0.47%
Though May-July had a significant positive run, that period’s 10 consecutive positive Friday’s merely served to balance 2014’s scales, leaving Friday with zero edge at 0.05%. Positive Fridays have been more plentiful; whereas negative Friday’s have had larger cumulative performance.
And isolating March-August NFP Fridays:
NFPs: 6 (including Thursday, July 3rd’s pre-holiday release)
- Average performance: -0.1%
- 3 positive (50%) — Average positive: 0.32%
- 3 negative (50%) — Average negative: -0.54%
NFP days fare a little worse than the general Friday at -0.1% across six occurrences. March-August is split down the middle at 3 positive and 3 negative. In general, NFP Fridays are underperforming Fridays in general.
For more detailed NFP statistics, check out this more comprehensive treatment;
For a historic review of how market performance has fared when NFP is trending above 200k (as it has for 6 consecutive months), check out this post reviewing data going back to the inception of the NFP data series in 1939.
Good Luck Today!
Twitter: @andrewunknown
Author holds no exposure to securities mentioned at the time of publication. Commentary provided is for educational purposes only and in no way constitutes trading or investment advice.


: All Energy Hands on Deck!")