Netflix (NFLX) has been a leader of the tech bull market for years.
From FANG to FAANG to FANMAG or whatever acronym analysts call tech leadership stocks, Netflix is one of them. And Netflix stock price may be on the verge of breaking out to the upside.
I say “may be” because we don’t have firm confirmation yet. This is where I become a major advocate of weekly charts.
Today I share a “daily” chart, showing Netflix rise to new highs this past week… only to close the week back inside the sideways trading channel. This is why “weekly” charts are key for trend traders to use for breakouts or breakdowns.
Note that the following MarketSmith charts are built with Investors Business Daily’s product suite.
I am an Investors Business Daily (IBD) partner and promote the use of their products. The entire platform offers a good mix of technical and fundamental data and education.
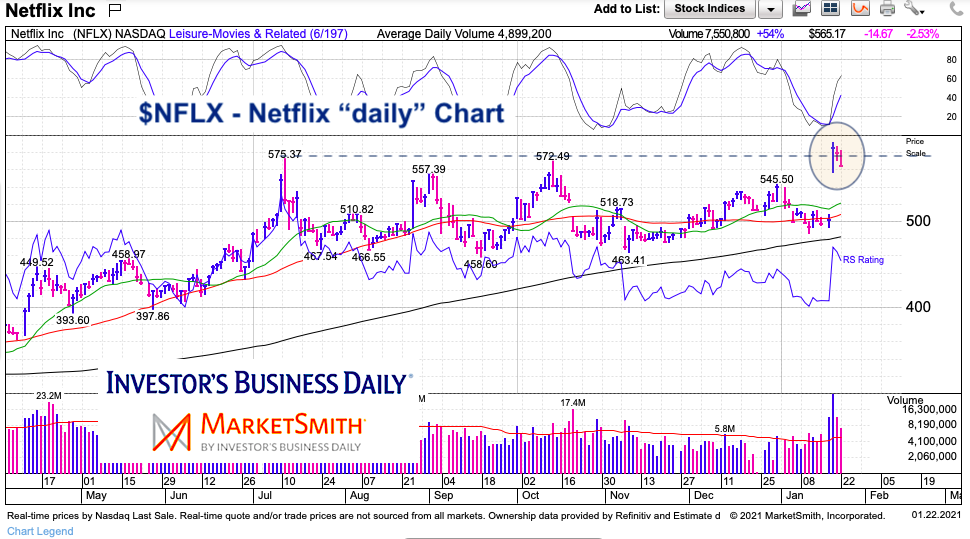
Netflix (NFLX) “daily” Chart
Here we can see the attempted breakout above $575. Netflix pressed as high as $593 before pulling back inside the channel and closing at $565. I like the upward pressure of the past couple months, but I want to see a weekly close above $575, and preferably above $593. See “weekly” chart below.
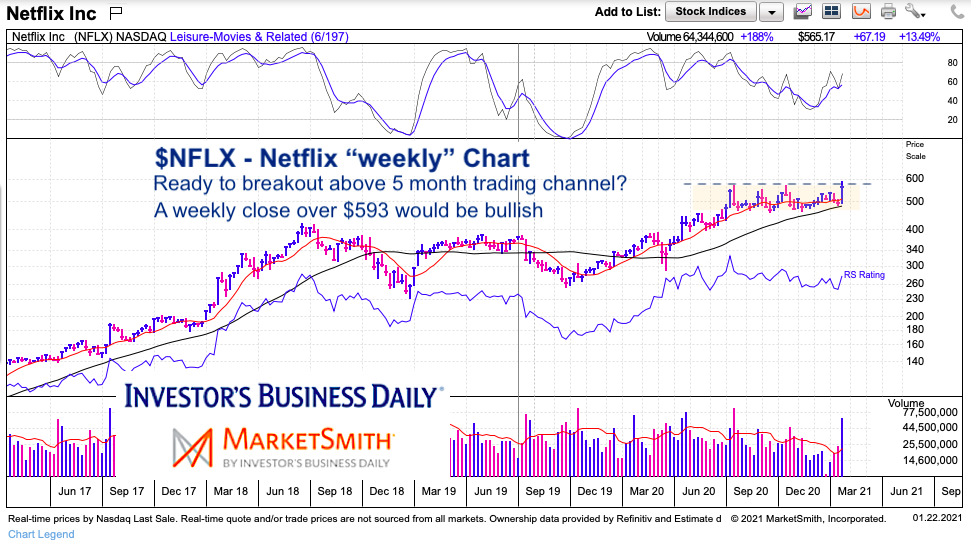
Netflix (NFLX) “weekly” Chart
Almost there… aggressive traders could go long on a weekly close over $575 and add on a close over $593. Or simply wait for a close over $593.
Twitter: @andrewnyquist
The author may have a position in mentioned securities at the time of publication. Any opinions expressed herein are solely those of the author, and do not in any way represent the views or opinions of any other person or entity.
: Creating Bullish Divergence?")


 and Semiconductors (SMH): Concerning Price Pattern?")


